
Quantification of Micrornas by Absolute Dpcr for the Diagnostic Screening of Colon Cancer
Abstract
There is currently no validated micro(mi)RNA diagnostic stool test to screen for colon cancer (CC) on the market because of the complexity of fecal density, vulnerability of stool to daily changes, and the presence of three sources of miRNAs in stool (cell-free from fecal homogenates, exsosomal miRNAs from fecal exosomes, and fecal colonocytes). To address these complexities, we have first carried out a microarray miRNA experiment, using Affymetrix GeneChip miRNA 2.0 Arrays, on immunocaptured and enriched stool colonocytes of 15 subjects (three healthy controls and twelve colon cancer patients [three TNM stage 0-1 (e.g., polyps◻ ³ 1 cm, villous or tubvillous, or with high grade dysplasia), three stage 2, three stage 3, and three stage 4 in triplicates to select a smaller panel of 14 preferentially expressed mature miRNAs associated with colon cancer (12 Up-Regulated, miR-19a, miR-20a, miR-21, miR-31, miR-34a, miR-96, miR-106a, miR-133a, miR-135b, miR-206, miR-224 and miR-302; and 2 Down-Regulated, miR-143 and miR-145). In a subsequent validation study carried out on total small RNA extracted by immunocapture, followed by RT that employed TaqMan® miRNA Reverse Transcription (RT) Kit and a Custom TaqMan RT Primer Pool, absolute quantification of miRNAs, in copies/µl, was measured using a chip-based Absolute QuantStudio 3D Digital PCR analysis. To ensure that we have chosen human and not bacterial small total RNA, we have carried out coextraction protocols with E. coli K1 strain RS18, compare Agilent electrophoretic patterns, and also sequenced random samples throughout this research using mRNA/miRNA sequencing.
Our initial quantitative dPCR miRNA data presented herein showe that the quantitative changes in the expression of a few mature miRNA genes in stool, which are associated with right and left colon cancer, would provide for a more convenient, sensitive and specific diagnostic screening markers thatare more useful than those test markers currently available on the market, such as the low-sensitivity (<15%) fecal occult blood test (FOBT); result in better compliance; and is more economical than the invasive and expensive colonoscopy exam in colon cancer, which can be cured if that cancer is detected at the early TNM stages, and that becomes incurable and deadly if not diagnosed before metastasis. Initial test performance characteristics of the miRNA approach showed that the test has a high numerical predictive value in colon cancer. Moreover, underpinning of the miRNA markers as a function of total RNA showed that the test can numerically differentiate between control subjects and colon cancer patients, particularly at the early stages of that curable cancer.
We propose to extend our initial research results to a larger prospective and randomized five-years nested case-control study, to validate the expression of the above 14 miRNAs, in stool of 180 individuals in an epidemiologically designed study, using (30 controls and 150 colon cancer patients (thirty precancerous polyps (stage 0-1), forty five stage 2, and seventy-five colon cancer stages 3 or 4). chosen randomly by an epidemiological method from 900 control and CC subjects to allow for an adequate time to collect the required 900 stool samples, as well as allowing for statistically valid analysis, standardized test conditions, and to provide a mean for determining the true sensitivity and specificity of a miRNA-screening approach in noninvasive human stool. Power-analysis has indicated that a total of 180 individuals, which will take us 5 years to enroll in testing, is an appropriate number of subjects to standardize and validate our proposed miRNA screening test. We may find out at the end of the proposed validation study in stool that fewer miRNAs, or even one miRNA, may suffice to serve as an efficient and a quantitative marker for the non-invasive diagnostic screening of colon cancer in human stool.
The above approach when combined with bioinformatics analysis, to correlate miRNA seed data with our previously published messenger (m)RNA target data in stool, allows for a thorough mechanistic understanding of how miRNA genes regulate mRNA expression, and would offer a better comprehensive diagnostic screening test for the non-invasive early detection stage (0-1) of colon cancer.
In order to show the clinical sensitivity and specificity of the proposed miRNA test, the absolute miRNA PCR values, in copies/µl, will be correlated with FOBT, colonoscopy, and pathology data. Standardization will establish test’s performance characteristics (sample selection, optimal sample running conditions, preservation and storage) to ensure that the assay will perform the same way in any laboratory, by any trained personnel, anywhere in the World. Ultimately, a smaller number of selected validated miRNAs (<10) showing increased and reduced expression could suffice to give quantitative miRNAs colon cancer expression values, useful for the early diagnostic screening of that curable cancer.
Article Information
- Received
- Accepted
- Published
Academic Editor: Leonardo Bustamante-Lopez, Sao Paulo University, Brazil
Checked for plagiarism: Yes
Review by: Single-blind
Copyright © 2019 Farid E. Ahmed, et al.
 This is an open-access article distributed under the terms of the Creative Commons Attribution License, which permits unrestricted use, distribution, and reproduction in any medium, provided the original author and source are credited.
Corresponding author: Farid E. Ahmed, GEM Tox Labs, Institute for Research in Biotechnology, 2905 South Memorial Drive, Greenville, NC 27834-6222, USA —
Competing Interests
The authors have declared that no competing interests exist.
Funding
No specific funding statement was provided by the authors.
Data Availability
No data-availability statement was provided by the authors.
Acknowledgements
We express our thanks to participating volunteers who provided stool samples for study. We thank Dr. Paul W. Vos at Department of biostatistics, East Carolina University, Greenville, NC for his statistical insight, and Dr. Clark D. Jeffries at Renaissance Computing Institute, University of North Carolina at Chapel Hill for his help in bioinformatics' analysis. All authors declare no conflict of interest during carrying out of this research, or duing data anakysis.
Citation:
Introduction
The discovery of small noncoding protein sequences, 17,27 nucleotides long RNAs (microRNAs), has opened new opportunities for a non-invasive test for early diagnosis of many cancers 1. The latest miRBase release 22 on, March 12, 2018 (http://ww.mirbase.org) indicates the total number of miRNAs labeled “high confidence” has increased by 168, to 1996, than in the previous release. That increase is partly due to incorporation of more deep sequencing datasets, and also because of relaxation of one criterion: A few sequences labeled as high confidence in miRBase 20 have disappeared in the miRBase 21 set, because high confidence sequences must either: (a) have at 10 reads mapping to each arm, as before, *or* (b) have at least 5 reads mapping to each arm *and* at least 100 reads mapping in total. The latter case helps to catch some of the well-established, highly expressed miRNAs that have very high arm expression bias — that is, a large number of reads mapping to one arm, and a small number to the other 2.
A recent study examined global expression of 735 miRNAs in 315 samples of normal colonic mucosa, tubulovillus adenomas, adenocarcinomas proficient in DNA mismatch repair (pMMR), and defective in DNA mismatch repair (dMMR) representing sporadic and inherited CRC stages I-IV 20. Results showed that: a) the majority of miRNAs that were differentially expressed in normal and polyps [miR-1, miR-9, miR-31, miR-99a, miR-135b and miR-137) were also differentially expressed with a similar magnitude in normal versus both the pMMR and dMMR tumors, b) all but one miRNA (miR-99a) demonstrated similar expression differences in normal versus carcinoma, suggesting a stepwise progression from normal colon to carcinoma, and that early tumor changes were important in both the pMMR- and dMMR-derived cancers, c) several of these miRNAs were linked to pathways identified for colon cancer, including APC/WNT signaling and cMYC, and d) four miRNAs (miR-31, miR-224, miR-552 and miR-592) showed significant expression differences (≥ 2 fold changes) between pMMR and dMMR tumors. The data suggest involvement of common biologic pathways in pMMR and dMMR tumors in spite of the presence of numerous molecular differences between them, including differences at the miRNA level 20, 21.
Unlike screening for large numbers of messenger (m)RNA, a modest number of miRNAs is used to differentiate cancer from normal 1, 10, 16, 18, 19, 20, and unlike mRNA 22, miRNAs in stool remain largely intact and stable for detection 23. Therefore, miRNAs are better molecules to use for developing a reliable noninvasive diagnostic screen for colon cancer, since we have found out during preliminary studies that: a) the presence of Escherichia coli does not hinder detection of miRNA by a sensitive technique such as dPCR, as the primers employed are selected to amplify human and not bacterial miRNA genes 24, and b) the miRNA expression patterns are the same in primary tumor, or diseased tissue, as in stool samples 1, 21, 23. The gold standard to which the miRNA test will be compared is colonoscopy, which will be obtained from patients’ medical records. However, because the low sensitivity guaiac FOBT is still the most commonly used screen in annual checkups 25, 26, 27, 28, 29, (www.cancer.org), we will also include this test for comparison with our proposed molecular diagnostic screening miRNA approach in human stool.
Isolation of colonocytes from stool samples is needed to perform an acceptable cytology, and will be used to provide a quantitative estimate of how our miRNA method performs. Although we may miss exosomal RNA, a parallel test could also be carried out on miRNAs obtained from stool samples to compare the extent of loss when colonocytes are only used, and an appropriate corrections for exsosomal loss can then be made 30.
The biomarker validation approach outlined in this proposal has been designed to test the hypothesis that “quantitative measurement of the expression of a carefully-selected panel of miRNAs in stool by dPCR is a reliable, sensitive and specific diagnostic indicator, for early non-invasive screening of colon cancer”. To prove this hypothesis, it must first be validated in a study, as proposed herein, using a nested case control epidemiology design and employing a prospective specimen collection, retrospective blind evaluation (PRoBE) of control subjects and test colon cancer patients 31, as specifically delineated by the National Cancer Institute’s (NCI’s) Early Detection Research Network (EDRN) http://edrn.nci.nih.gov for cancer biomarker discovery studies.
Innovation of the dPCR-miRNA stool screening approach lies in the collective use of many methods in the proposed research, such as: immunoparamagnetic beads 25, 26 to capture colonocytes from the harsh, but noninvasive stool environment, whose extracted fragile total small RNA is stabilized shortly after stool excretion by commercial kits so it does not ever fragment, followed by standardized analytical quantitative miRNA dPCR-chip profiling in noninvasive stool samples, which are neither labor intensive, nor require extensive sample preparation, to develop a panel of few stable miRNAs for absolute quantitative diagnostic screening of early sporadic colon cancer (stage 0-1), more economically and with higher sensitivity and specificity than any other colon cancer screening test on the market today 1, 21, 22, 23, 24, 25, 26, 27, 28, 29.
Epidemiology of Colon Cancer
Colorectal cancer (CRC) is the third most common malignancy worldwide, with an estimated one million new cases and a half million deaths each year 1, 23. Screening for CRC allows early stage diagnosis of the malignancy and potentially reduces disease mortality 28, 29. The convenient and inexpensive fecal occult blood test (FOBT) screening test has low sensitivity and requires dietary restriction, which impedes compliance and use 29. CRC is the only cancer for which colonoscopy is recommended as a screening test 21, 22, 23. Although colonoscopy is a reliable screening tool, the invasive nature, abdominal pain and high cost have hampered worldwide application of this procedure25 (www.cancer.org). In comparison to the commonly employed low sensitivity FOBT tests, a noninvasive sensitive screen for which there would be no requirement for dietary restriction would be a more convenient test. Epidemiological evidence suggests that colon cancers (CCs) and rectal cancers (RCs) differ in their morbidities and etiologies 32, 33, 34, 35, 36, 37, 38. RC is more common in China where it accounts for over 50% of CRC, compared with < 30% in western countries. Data from Peking Union Medical College Hospital, China, indicates that colon & rectal cancers accounted for 55.6% and 44.4% of CRC, respectively, during the years 1989 through 2008, and are more prevalent in younger Asian individuals 39. In contrast, coloncancer was shown to account for over 60% of CRC cases in the USA and Europe, and is related to fatty foods, less exercise and a Caucasian ethnic origin 27, 28, 29, which suggest differences in carcinogenesis between CC and RC. Several structural and molecular studies have indicated differences in etiology, clinical manifestation, pathological features and genetic abnormalities between CC and RC 31, 32, 33. The proximal colon, distal colon and rectum have different embryological origin. Molecular studies found that tumor suppressor genes, point mutations and genetic instability differ according to the subsite colorectum. CC has been reported to more likely have CpG island methylator phenotype and k-ras mutations, whereas rectal and distal colon tumors are more likely to have p53 and APC mutations 34, 35, 36, 37. Gene hybridization techniques have shown amplification of 20q in CC, compared with amplification of 12p in RC 38.
A study indicated significant differences between rectal and colon cancer in the amplification of genes for cell cycle as cyclin-A2, -B1, -D1 and –E 40. An omic study using Illumina HT-12 V4.0 Expression Beadchip oligonucleotide microarrays, found RC to be more complex than CC as 676 genes related to 11 pathways in CC and 1,789 genes related to 30 signal pathways altered in RC, with 824 common differentially expressed genes up- or down-regulated in both Cancers 40, leading to the conclusion that colon and rectal cancers represent two distinct types of tumors. We have focused in our research on colon cancer as it is more abundant in the USA, and more CC patients report to our Collaborating Clinics, compared to RC.
Materials and Methods
We have first carried out a global microarray expression analysis study 41, 42, 43 using an exfoliated colonocytes enrichment strategy 44, 45, 46, 47, which employed 15 subjects (three controls, three TNM stage 0-1, three stage 2, two stage 3, and three stage 4 colon cancer) in triplicates, using Affymetrix GeneChip miRNA 2.0 Array, containing 15,644 probe sets that provides 100% miRBase v15 coverage, to select a panel of miRNAs for subsequent dPCR studies, as we have detailed before 41, 42, 43. Microarray results showed 180 preferentially expressed miRNA genes that were either increased (124 miRNAs), or reduced (56 miRNAs) in expression in stool samples from colon cancer patients. We then carefully selected 14 miRNAs, 12 of them showed increased expression and 2 showed decreased expression, as presented in Table 1 & Table 2, and Figure 1 below, for further analysis of absolute miRNAs expression by a chip-based digital (d) PCR test in a proposed validation study 48, 49, 50.
Table 1. Characteristics of Fourteen Up- or Down-Regulated MicroRNAs in Human Stool.| MiRNA | Up-Regulated | Down-Regulated | Chromosome Location | Known Putative Cancer Target Gene(s) |
| MiR-19a | Yes | No | 13q31.3 | Undetermined |
| MiR-20a | Yes | No | 13q31.3 | PTEN, TMP1 |
| MiR-21 | Yes | No | 17q23.1 | PTEN,BCL2,PDCD4,TIMP3,SPRY2,REC,T1AM1 |
| MiR-31 | Yes | No | 9p21.3 | T1AM1,AX1N1,FOXC2,FOXP3,H1F1AN |
| MiR-34a | Yes | No | 1p36.22 | BCL2,TP53,E2F3,NOTCH1,E2F1,S1RT |
| MiR-96 | Yes | No | 17q32.2 | KRAS |
| MiR-106a | Yes | No | Xq26.2 | PTEN,E2F1,RB1 |
| MiR-133a | Yes | No | 18q11.2/20q13.33 | BAX,KRAS |
| MiR-135b | Yes | No | 1q32.1 | MSH2 |
| MiR-200c | Yes | No | 12p13.31 | ZEB1 |
| MiR-224 | Yes | No | Xp23 | Undetermined |
| MiR-30a | No | Yes | 6q13 | RASA1,ERG,SEMA6D,SEMA3A |
| MiR-143 | No | Yes | 5q32 | KRAS,MAPK7.DNMT3A |
| MiR-145 | No | Yes | 5q32 | TGFBRE,APC,IRS1,STAT1,YES1,FLI1 |
Our absolute dPCR data tabulated in Table 2, and presented graphically in Figure 1 below, show 14 preferentially expressed mature miRNAs associated with colon cancer (12 Up-Regulated, miR-19a, miR-20a, miR-21, miR-31, miR-34a, miR-96, miR-106a, miR-133a, miR-135b, miR-206, miR-224 and miR-302; and 2 Down-Regulated, miR-143 and miR-145) in stool samples from healthy controls, and stages 0-1 to 4 individuals with colon cancer .
Figure 1. Diagram illustrating Quant Studio TM 3D Digital PCR System Chip; ChipCase Lid (1);Digital PCR 20K 10 mm2 nanofluidic v2 chip (2), which contains 20,000 reaction wells; QuantStudioTM 3D Digital PCR Chip Case (3); Chip ID (4); Fill port (5); and Reaction wells, the 20,000 physical holes that suspend individual PCR reactions.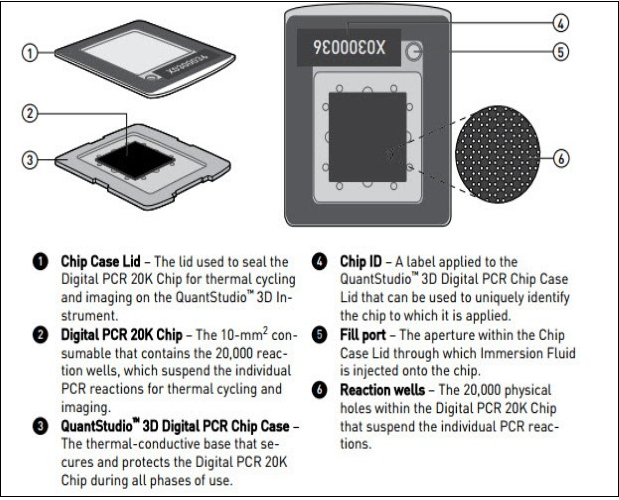
Download figure
| Type | miR-19a | miR-20a | miR-21 | miR-31 | miR-34a | miR-96 | miR-106a | miR-133a | miR-135b | miR-200c | miR-224 | miR-30a | miR-143 | miR-145 |
| control | 9964.23 | 9724.14 | 9699.68 | 9591.16 | 9580.92 | 9590.59 | 9464.64 | 9574.13 | 9568.15 | 9556.85 | 9631.73 | 9401.81 | 9585.54 | 9583.18 |
| control | 9984.55 | 9890.38 | 9795.44 | 9588.24 | 9602.9 | 9587.82 | 9592.68 | 9680.24 | 9515.46 | 9511.29 | 9592.62 | 9580.92 | 9504.61 | 9506.12 |
| control | 9950.19 | 9898.88 | 9938.74 | 9791.83 | 9894.82 | 9862.24 | 9875.88 | 9800.08 | 9824.18 | 9843.18 | 9810.2 | 9780.74 | 9699.52 | 9823.54 |
| stage01 | 7998.16 | 8011.92 | 7949.68 | 7864.18 | 7880.18 | 7790.44 | 7682.74 | 7687.88 | 7561.64 | 7402.8 | 6994.24 | 6892.54 | 1995.92 | 1884.54 |
| stage01 | 7814.22 | 7901.24 | 7890.32 | 7798.92 | 7780.28 | 6849.68 | 6999.68 | 6742.6 | 6640.16 | 6616.1 | 6872.54 | 6640.24 | 1879.04 | 1764.92 |
| stage01 | 7764.5 | 7745.38 | 7690.32 | 7549.28 | 7610.32 | 6787.62 | 6870.96 | 6739.42 | 6690.82 | 6584.74 | 6477.52 | 6454.44 | 1799.92 | 1668.19 |
| stage2 | 7414.42 | 7569.16 | 7529.9 | 7492.68 | 7384.82 | 7189.64 | 6794.88 | 6690.98 | 6504.2 | 5702.16 | 5464.16 | 4870.22 | 1346.48 | 1040.26 |
| stage2 | 7390.84 | 7490.96 | 7501.62 | 7379.04 | 7202.28 | 7102.28 | 6472.48 | 6598.24 | 6242.82 | 4387.76 | 5414.08 | 4189.42 | 988.14 | 862.08 |
| stage2 | 7208.16 | 7378.74 | 7402.68 | 7299.76 | 7124.56 | 7098.04 | 6402.18 | 6401.16 | 6218.92 | 4123.18 | 4098.78 | 3894.9 | 872.4 | 763.14 |
| stage3 | 6850.14 | 6936.16 | 6902.04 | 6890.14 | 7092.18 | 6586.18 | 6319.08 | 5898.36 | 5386.66 | 3821.22 | 3679.62 | 3601.4 | 365.42 | 256.28 |
| stage3 | 6792.75 | 6790.29 | 6776.26 | 6658.78 | 6674.54 | 6560.68 | 6116.84 | 5602.16 | 4999.16 | 3715.22 | 3686.92 | 3570.92 | 260.14 | 154.02 |
| stage3 | 6622.84 | 6662.9 | 6694.28 | 6558.84 | 6554.28 | 6510.27 | 6039.84 | 5404.68 | 5498.82 | 3421.22 | 3614.62 | 3120.18 | 194.84 | 133.37 |
| stage4 | 6506.92 | 6538.8 | 6419.02 | 6227.54 | 5978.48 | 5766.32 | 5686.36 | 5256.81 | 4973.28 | 3327.28 | 3479.52 | 2052.38 | 92.45 | 88.49 |
| stage4 | 6468.22 | 6384.12 | 6397.92 | 6117.12 | 5856.66 | 5681.82 | 5259.84 | 4905.76 | 3840.86 | 3244.16 | 3276.42 | 1096.44 | 76.88 | 67.42 |
| stage4 | 6488.38 | 6434.48 | 6346.06 | 5898.78 | 5466.16 | 5372.56 | 4896.36 | 4812.44 | 3784.56 | 3164.8 | 3186.14 | 678.56 | 56.82 | 49.26 |
3D Chip-Based Digital PCR
We further calculated standard deviations (sd) obtained from the one way ANOVA, using the 5 level factor Type (normal, stage01, stage2, stage3, stage4). The adjusted R-squared values representing the proportion of variation explained by Type are also reported.Type was statistically significant for every gene; all p-values were less than 0.000001 (no adjustments for multiple comparisons). These data are tabulated in Table 3, and shown graphically in Figure 1, below.
Table 3. Representation of SDs and R2 for miRNAs tested by absolute digital PCR| Type | miR-19a | miR-20a | miR-21 | miR-31 | miR-34a | miR-96 | miR-106a |
| sd | 92.239 | 111.10331 | 99.76355 | 146.64101 | 209.04905 | 278.47558 | 301.87638 |
| r2 | 99.4831 | 99.18486 | 99.34603 | 98.65141 | 97.63002 | 96.13899 | 96.19772 |
| Type | miR-133a | miR-135b | miR-200c | miR-224 | miR-30a | miR-143 | miR-145 |
| sd | 300.06189 | 409.67168 | 449.86741 | 376.84372 | 424.99723 | 132.76331 | 110.89266 |
| r2 | 96.85741 | 95.49454 | 96.70427 | 97.61795 | 97.95389 | 99.87075 | 99.91289 |
For each gene on the graph in Figure 1, we have shown the min and max in order to make the presentation clearer. At top left is high exxpression Value of 9985, which is the maximum value for that gene, at the bottom one finds the value for the minimum The colors range from dark blue (control) to orange (stage 4). The groups are also distinguished by line type: control (solid), stage 0-1 (long dash), stage 2 (dash), stage 3 (dot), stage 4 (dash nd dot). The figure is a parallel coordinate plot made in R 51, using the package MASS 52.
Stool Collection and Storage
Stool was obtained from 15 participating subjects {three healthy controls and twelve colon cancer patients of all the colon cancer stages (three TNM stage 0-1 (e.g., polyps◻³ 1 cm, villous or tubvillous, or with high grade dysplasia), three stage 2, three stage 3, and three stage) 23. All stools were collected with sterile, disposable wood spatulas in clean containers, after stools were freshly passed, it was then placed for storage into Nalgene
screw top vials (Thermo Fisher Scientific, Inc., Palo Alto, CA, USA), each containing 2 ml of the preservative RNA later (Applied Biosystems/Ambion, Austin, TX, USA), which prevents the fragmentation of the fragile mRNA molecule 22, and vials were stored at – 80 °C until samples were ready for further analysis. Total small RNA, containing miRNAs, was extracted from all frozen samples at once, when ready, and there was no need to separate mRNA containing small miRNAs from total RNA, as small total RNA was suitable to make ss c-DNAs.
Extraction of Total Small RNA
A procedure used for extracting small total RNA from stool was carried out using a guanidinium-based buffer, which comes with the RNeasy isolation Kit®, Qiagen, Valencia, CA, USA, as we have previously detailed 22. DNase digestion was not carried out, as our earlier work had demonstrated no difference in RNA yield or effect on RT or PCR after DNase digestion 23, 41, 42, 43. The time taken to purify aqueous RNA from all of the 15
frozen stool samples was ~ two hours. Small RNA concentrations were measured spectrophotometrically at λ 260 nm, 280 nm and 230nm, using a Nano-Drop spectrophotometer (Themo-Fischer Scientific). The integrity of total RNA was determined by an Agilent 2100 Bioanalyzer (Agilent Technologies, Inc., Palo Alto, CA, USA) utilizing
the RNA 6000 Nano LabChip®. RNA integrity number (RIN) was computed for each sample using instrument's software 22, 23, 42, 43, 53, 54, 55, 56, 57.
Preparation of ss-cDNA for Molecular Analysis
The RT2 miRNA First Strand Kit® from SABiosciences Corporation (Frederick, MD, USA) was employed for making a copy of ss-DNA in a 10.0 µl reverse transcription (RT) reaction, for each RNA samples in a sterile PCR tube, containing 100 ng total RNA, 1.0 µl miRNA RT primer & ERC mix, 2.0 /µl 5X miRNA RT buffer, 1.0 µl miRNA RT enzyme mix, 1.0 µl nucleotide mix and Rnase-free H2O to a final volume of 10.0 µl. The same amount of total RNA was used for each sample. Contents were gently mixed with a pipettor, followed by brief centrifugation. All tubes were then incubated for 2 hours at 37oC, followed by heating at 95oC for 5 minutes to degrade the RNA and inactivate the RT. All tubes were chilled on ice for 5 minutes, and 90 µl of Rnase-free H2O was added to each tube. Finished miRNA First Strand cDNA synthesis reactions were then stored overnight at -20oC 22, 23, 42, 53, 54, 55, 56, 57.
Experimental Digital Absolute Quantitative PCR Approach
Because the use of 96- or 384-well plates for a single sample is nether practical or affordable, nor very accurate, widespread implementation of dPCR technology has necessitated the introduction of nanofluidic techniques and/or emulsion chemistries. Three enhancements associated with dedicated instruments have helped promote the use of dPCR: (a) Partition volumes have been lowered to as little as 5 picoliter (pl); (b) The partitioning process has been automated, and (c) The number of partitions has been increased to over 100,000 for a single experiment. These innovative elements have simplified dPCR, and increased its precision, while holding down the total reaction value of a single experiment, compared to that of a conventional qPCR 48, 49, 50, 51.
Digital PCR is a new approach to miRNAs quantification that offers alternate method to qPCR for absolute quantification, by partitioning a sample of DNA or cDNA into many individual, parallel PCR reactions; some of these reactions contain the target molecule (positive), while others do not (negative). A single molecule can be amplified a million-fold or more. During amplification, TaqMan chemistry with dye-labeled probes is used to detect sequence-specific targets. When no target sequence is present, no signal accumulates. Following PCR analysis, the fraction of negative reactions is used to generate an absolute count of the number of target molecules in the sample, without the need for standards or endogenous controls. In conventional qPCR, the signal from wild-type sequences dominates and obscures the signal from rare sequences 55, 56, 57. By minimizing the effect of competition between targets, dPCR overcomes the difficulties inherent to amplifying rare sequences and allows for sensitive & precise absolute quantification of the selected miRNAs.
Applied Biosystem QuantStudio™ 3D instrument used in this research study only performs the imaging and primary analysis of the digital chips. The chips themselves must be cycled offline on a Dual Flat Block GeneAmp® 9700 PCR System. or the ProFlex™ 2x Flat PCR System. The QuantStudio™ 3D Digital PCR System can read the digital chip in less than 1 minute, following thermal cycling 48. It allows for one sample per chip; although, duplexing allows for analsis of two targets per chip. Sample prep for digital PCR is no different than for real-time PCR, when using the QuantStudio™ 3D Digital PCR System. To figure out the concentration of cDNA stock from results, if one includes all of the necessary dilution factors into the AnalysisSuite™ software, the software will give the copies/µL in the stock.
There are 2 dilutions that one needs to take into account: (a)The first is the dilution of the sample in the reaction,. and (b) The second is the dilution of the stock that one makes before adding it to the digital PCR reaction. For example, if one wants to add 1 µL of a sample that has been diluted 1:10 from the stock. Thus, if one adds 1 µL of his/her sample to a 16 µL (final volume) reaction, the dilution factor of the sample is 1:16 or 1/16 = 0.0625. Since the stock has also been diluted 1:10 (0.1), one also need to factor this in. The final dilution factor to enter into the software is 0.0625 x 0.1 = 0.00625 (1:160). One can use either annotation to indicate the dilution factor in the AnalysisSuite™ software. If one enters that value into the “Dilution” column, the software will give the copies/µL in the starting material (stock). The Poisson Plus algorithm for projects that contain QuantStudio™ 3D Chips with target, quantities >2000 copies/μL. The Poisson Plus algorithm corrects for well-to-well load volume variation, on a per Chip basis. This becomes important at higher target concentrations. There is also an option to export the Chip data as XML on the Export tab-thousands of discrete subunits prior to amplification by PCR, each ideally containing either zero or one (or at most, a few) template molecules 50.
Each partition behaves as an individual PCR reactions –as with real-time PCR—fluorescent FAM probes (or others, as VIC fluorescence). Samples containing amplified products are considered positive (1, fluorescent), and those without product –with little or no fluorescence (i.e., are negative, 0). The ratio of positives to negatives in each sample is the basis of amplification. Unlike real-time qPCR, dPCR does not rely on the number of amplification cycles to determine the initial amount of template nucleic acid in each sample, but it relies on Poisson Statistics to determine the absolute template quantity. The unique sample partitioning step of dPCR, coupled with Poisson Statistics allows for higher precision than both traditional and qPCR methods; thereby allowing for analysis of rare miRNA targets quantitativley and accuratley 50, 51.
The use of a nanofluidic chip, shown below, provides a convenient and straight forward mechanism to run thousands of PCR reactions in parallel. Each well is loaded with a mixture of sample, master mix, and Applied Biosystems TaqMan Assay reagents, and individually analyzed to detect the presence (positive) or absence (negative) of an endpoint signal. To account for wells that may have received more than one molecule of the target sequence, a correction factor is applied using the Poisson model. It features a filter set that is optimized for the FAM™, VIC®, and ROX™ dyes, available from Life Technologies 49, (Figure 2).
Figure 2. Workflow of a digital miRNAs PCR for colon cancer profiling in human colon tissue or stool samples.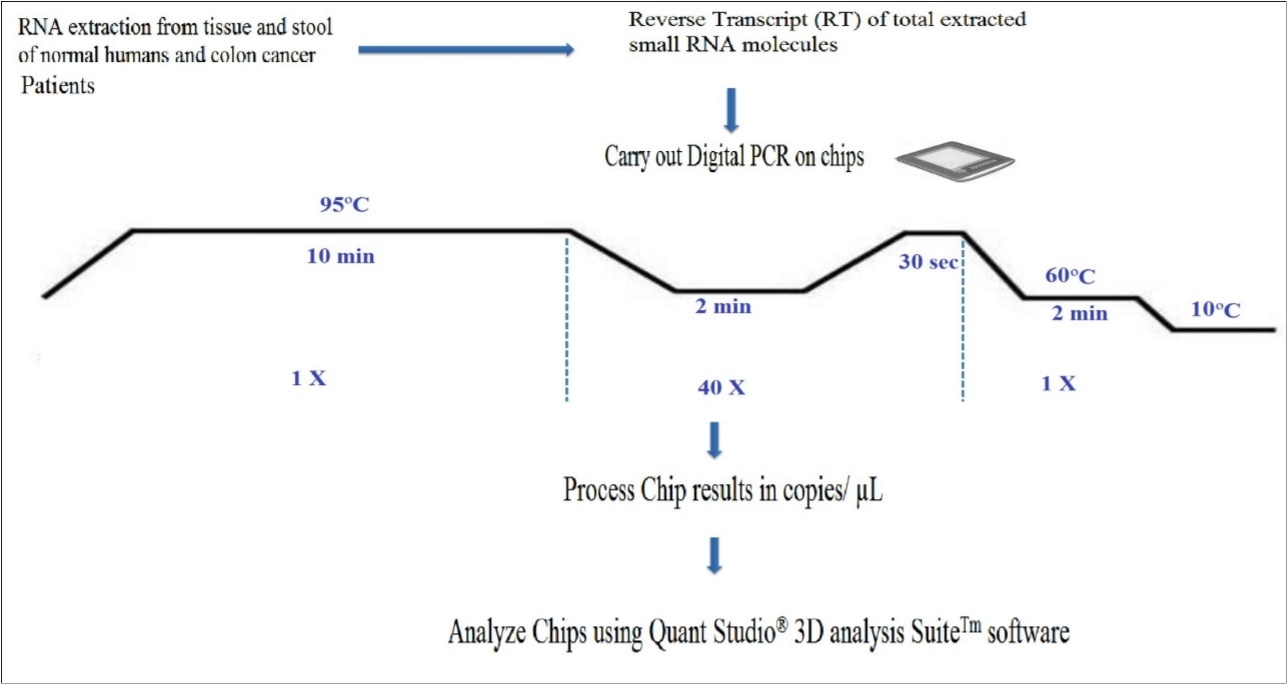
Download figure
A workflow of the dPCR procedure by the QuantStudioTM 3D Digital PCR System Chip is presented in Figure 3, below. Digital PCR, however, has several tips to follow: 1) A rough estimate of the concentration of miRNAs of interest has to be first carried out, in order to make appropriate dilutions, so that not too many partitions will get multiple copies that prevent accurate calculation of the copy number of miRNAs of interest; 2) Non-template controls and a RT negative control must be set up for each miRNA, when using a “primer pool method” for retro-transcription; 3) A chip-based dPCR method requires less pipetting steps, which reduces potential PCR contamination compared to another type of dPCR marketed by Bio-Rad Laboratories, thus called “Bio-Rad's droplet digital PCR”, which requires multiple pipette transfers that potentially increase the risk of contamination 50, and 4) Quant StudioTM 3D chip has 20,000 fixed reaction wells, whereas Bio-Rad's droplet PCR relies upon the generation of droplets; a step that could be extremely variable, as reported by Miotto et al11, 48.
Figure 3. Absolute Quantification of Up- or Down-Regulated miRNAs in Human Stool by QuantStudioTM 3D Digital PCR Chip System.
Download figure
Acquisition of Patients and Specimens for Carrying out the Clinical Study
Our collaborating clinicians are aware of the constraints imposed by working with RNA and the need to preserve it so it does not ever fragment thereafter. 22, 23, 41, 42, 43. Participating clinics will consent prospective individuals when they report to the clinic for consult. Those individuals not showing any polyps, or inflammatory bowel diseases, such as colitis or diverticulitis, will be asked by their physicians if they wish to participate in the study. If they agree, they/their guardian will be consented, each given a stool collection kit and detailed collection instructions. Each study subject will collected one 10 g stool sample, in a standardized fashion, in a large 40 cc plastic jacket given to each participating, consented individual, prior to any bowel preparation. The study nurse will show and ask participants to brush both the mucinous layer, which is rich in colonocytes, and the non-mucinous parts of stool in order to have a representation of the entire colon (both right and left side colon) 1, 27, 54, 55, 56, 57, to be preserved overnight at room temperature in the fixative RNALater® (Invitrogen) added at 2.5 ml per 1 g of stool, followed by calling the laboratory personnel to pick up the sample by next morning. Samples will be stored at -80oC in small aliquots until needed. International Collaborators will also give study participants these written instructions in their native languages to ensure standardization, and will explain to them what's needed to collect samples representing both right and left side colon. When ready for analysis, samples are defrosted at room temp, filtered through a nylon mesh by laboratory personnel, in order to remove the preservative, and any debris prior to extraction of total small RNA. All laboratory work will be carried out and standardized under blind conditions and, in accordance with organization’s Standard Operating Procedures (SOPs) for handling of biohazardous waste material 1, 21, 22, 23.
Randomized Selection of Control Human Subjects and Case Patients
To avoid bias, and ensure that biomarker selection and outcome assessment will not influence each other, a prospective specimen collection retrospective blinded evaluation (PRoBE) design randomized selection 31 of control subjects and case patients from our consented cohort population, will be employed, without nopriori knowledge of who has what diagnosis, and stool specimens collected prior to removal of the lesion on patients undergoing colonoscopy, which will form the cohort.
By the 8th months of each year, we would have a cohort of 135 subjects, who are representative of the entire cohort, to select 6 control subjects and 30 CC patients. This will undoubtedly be the least common of the three groups (normal, adenoma & cancer) by far. We will then match 1 to 1 adenoma cases to the cancer cases for age (+/- 5 years), gender, clinic and month of diagnosis. Similarly, we will then match the normal controls from among the collected specimens to the cancer and adenoma cases. If there is no match, we will liberalize the data restriction to allow +/- 2 months. Thus, we will collect a case-case-control group nested in the overall colonoscopy cohort that is collected. The absolute quantitative dPCR miRNA expression analysis will be carried out on all coded samples at once during the last three months of each study year as shown in the time line Table 4, with the investigators blind to knowledge of the patients’ diagnosis, so that no analytical bias is introduced to the study.
Table 4. Timeline for accomplishing research aims during the proposed 5 years study| Aim 1: | Aim 2: | Aim 3: | Aim 4: | Aim 5: | Aim 6: | |
| Method-Aim/Months | Standardize sample acquisition, handling & epidemiol- ogically select population OR Collect samples in yrs 2-5 | Standardize total small RNA extraction; use dPCR to study miRNAs gene expression | Use statistics for data analysis &bionformatics to idenify control elements | Finalizeaccessing test performance characteristiccs of the dPCR-miRNA approach | Provide numerical under pinning of miRNA as a function of total RNA | Provide alternate standardized methods toachieve aims |
| 1-4 | ◻◻◻◻◻◻◻◻◻◻a | |||||
| 5-8 | ◻◻◻◻◻◻◻◻◻ | ◻ | ||||
| 9-12 | ◻◻◻◻ | ◻◻◻ | ◻ | ◻ | ||
| 13-16 | ◻◻◻◻◻◻◻◻◻◻ | |||||
| 17-20 | ◻◻◻◻◻◻◻◻◻ | ◻ | ||||
| 21-24 | ◻◻◻◻ | ◻◻◻ | ◻ | ◻ | ◻ | |
| 25-28 | ◻◻◻◻◻◻◻◻◻◻ | ◻ | ||||
| 29-32 | ◻◻◻◻◻◻◻◻◻ | ◻ | ||||
| 33-36 | ◻◻◻◻ | ◻◻◻ | ◻ | ◻ | ◻ | |
| 37-40 | ◻◻◻◻◻◻◻◻◻◻ | ◻ | ||||
| 41-44 | ◻◻◻◻◻◻◻◻ | ◻ | ||||
| 45-48 | ◻◻◻◻ | ◻◻◻ | ◻ | ◻ | ◻ | |
| 49-52 | ◻◻◻◻◻◻◻◻◻◻ | |||||
| 53-56 | ◻◻◻◻◻◻◻◻◻ | ◻ | ||||
| 57-60 | ◻ | ◻◻◻◻ | ◻◻ | ◻◻ | ◻ |
While we believe that the 135 stool samples collected every year are representative of the overall cohort, there may be some volunteer bias, which we will not know how it would affect the studied miRNA markers. Therefore, we will collect demographic & clinical data on both groups (those who participated & those who did not) and compare for the following factors: age, gender, race/ethnicity, reason for colonoscopy, diagnoses, so that an assessment can be made at study conclusion as to what degree selection may have affected the study results.
Enrichment & Exfoliation Strategy of Colonocytes from Stool for miRNA Profiling
Approximately 1 g of thawed stool is homogenized in a Stomacher® 400 EVO Laboratory Blender (Seward, UK) at 200 rpm for 3 minute, with 40 ml of a buffer of Hank’s solution, containing 10% fetal bovine serum (FBS) and 25 mmol/L Hepes buffer (pH 7.35). The homogenates is filtered through a nylon filter (pore size 512 µm), followed by addition of 80 µl of Dynal superparamagnetic polystyrene beads (4.5 µm diameter) (Invitrogen, Carlsbad, CA, USA) coated with a mouse IgG1 monoclonal antibody (Ab) Ber-Ep4 (Dako, Glostrup, Denmark) specific for an epitope on the protein moiety of the glycopolypeptide membrane antigen Ep-CAM, which is expressed on the surface of human epithelial cells, including colonocytes and colon carcinoma cells 58, 59, at a final concentration of 12 ng of Ab/mg magnetic beads (1 µg Ab/106 target cells). The mixtures is incubated for 30 min on a shaking platform at room temperature. To visualize colonocytes. a drop of the solution is spread on a glass slide, dried and stained with Diff-Quick stain (Fisher Scientific, Pittsburgh, PA), and another drop is placed on a hemocytometer, and counted under the microscope to estimate the number of colonocytes form which total small RNA will be extracted. The supernatant is removed and the pellet containing colonocytes will be stored at –80oC until small RNA extraction 22, 59, 60.
By the 9 th month of each study year, isolation of colonocytes from stool, and comparing the Agilent electrophoretic (18S and 28S) patterns to those obtained from total RNA extracted from whole stool, and differential lysis of colonocytes by RT lysis buffer (Quagen), could be construed as a validation that the electrophoretic pattern observed in stool (18S and 28S) is truly due to the presence of human colonocytes, and not due to stool contamination with Escherichia coli (16S and 23S) 24. One must also take into account that some exsosomal RNA 30 will be released from purified colonocytes into stool, and correction is made for that effect.
Why use a miRNA Assay for Colon Cancer Screening
The expression of individual genes may be altered by mutations in the DNA, or by a change in their regulation at the RNA or protein levels. Epigenetic silencing is an important mechanism that contributes to gene inactivation in CRC 21. Analysis of promoter methylation of hypermethylated in cancer 1 (HIC1) gene in stool showed it to be highly specific (98%) for colon adenoma and carcinoma, but sensitivity was quite low (31% for adenoma & 42% for all cancer) 61, which suggested that an epigenetic marker only is not good enough for screening, but a combination of genetic and epigenetic markers would be required to reliably identify CRC at an early stage.
Working with the stable DNA has been relatively easy. A study by scientists affiliated with Exact Sciences Corp., Marlborough, MA, which markets a mutation-based DNA test, assessed a newer version of a fecal DNA test for CRC screening using a vimentin methylation marker and another mutation DY marker plus non degraded DNA in a limited sample of 44 CRC patients and 122 normal controls. It cited a sensitivity of 88% and a specificity of 82% only for advanced cancer, but not adenoma 62, 63. Besides, DNA mutation tests are not cost-effective, as screening for multiple mutations is expensive because these demanding mutation tests are not automated and are labor intensive. In addition, mutation detection in oncogenes and suppressor genes suffers from: a) the detection of mutations in these genes in fewer than half of large adenomas and carcinomas, b) the detection of gene mutations in non-neoplastic tissues, c) mutations found only in a portion of the tumor, and d) mutations often produce changes in the expression of many other genes 63, 64.
Protein-based methods are currently not suited for screening and early diagnosis either because proteins are not specific to one tumor or tissue type (e.g., CEA), their susceptibility to proteases, current lack of means to amplify proteins, no function is known for more than 75% of predicted proteins of multicellular organisms, there is not always a direct correlation between protein abundance and activity, and most importantly because detection of these markers exfoliately often signifies the presence of an advanced tumor stage. The dynamic range of protein expression in minimally-invasive body fluids (e.g., blood) is as large as 1010, 65. Moreover, mRNA levels do not necessarily correlate with protein expressions 66. Protein microarray studies revealed that protein expression vastly exceeds RNA levels, and only posttranslationally modified proteins are involved in signal transduction pathways leading to tumorigenesis 67. There is no well-documented protein test that has been shown in clinical trials to be a sensitive and a specific indicator of colon neoplasia, especially in early stages. More recently, a serum proteomic study employing liquid chromatography (LC)-mass spectrometry (MS) carried out in a nonbiased fashion failed to differentiate between individuals with large adenoma (1 cm) and normal individuals 68. Proteomic research is a relatively new discipline, so it will take considerable time to identify and validate proteins suitable for use as clinical markers, and resolve issues of bias and validations 65, 69.
On the other hand, a transcriptomic mRNA approach has shown promise to detect adenomas and colon carcinomas with high sensitivity and specificity in preliminary studies 22, but no randomized, standardized, blinded prospective clinical study has been carried out to validate the superiority of the mRNA approach. A study indicated that a combination of a transcriptomic mRNA and miRNA expression signatures improves biomolecular classification of CRC 69. Furthermore, not only does miRNAs regulate mRNA, but they also regulate protein expression. Two studies have shown that a single miRNA act as a rheostat to fine tune the expression of hundreds of proteins 70, 71. Hence, for CRC screening, miRNA markers are much more comprehensive and preferable to a DNA-, epigenetic-, mRNA- or a protein-based markers23. An added advantage of the use of the stable, nondegradable miRNAs by PCR expression, or chip-based methods is being automatable, which makes them much more economical and more easily acceptable by laboratory personnel performing these assays 48, 49, 50, 51.
Suitability of Stool for Developing a Highly Sensitive Diagnostic Biomarker Screen for Colon Cancer
Links between miRNAs and CRC have been reported in several studies in colon cancer cell lines, cells in culture, blood, colon tissue of CRC patients, and human stool 23, 43, 54, 55, 56, 57.
Stool testing has several advantages over other colon cancer screening methods as it is truly noninvasive and requires no unpleasant cathartic preparation, formal health care visits, or time away from work or routine activities. Unlike sigmoidoscopy, it reflects the full length of the colorectum and samples can be taken in a way that represents the right and left side of the colon. It is also believed that colonocytes are released continuously and abundantly into the fecal stream 79, 80, contrary to blood that is released intermittently as in guaiac FOBT 25; therefore, this natural enrichment phenomenon partially obviates the need to use a laboratory-enrichment technique to enrich for tumorigenic colonocytes, as for example when blood is used for testing. Furthermore, because testing can be performed on mail-in-specimens, geographic access to stool screening is essentially unimpeded. The American Cancer Society (ACS) has recognized stool-based molecular testing as a promising screening technology for CRC (www.cancer.org).
Our results and others have show that even the presence of bacterial E. coli DNA, non-transformed RNA and other interfering substances in stool does not interfere with measuring miRNA expression 1, 22, 23, 51, 52, 53, 54, 55, 56, 57, when an enrichment method such as the immunological paramagnetic capture method is used 25, 26, when good ss-cDNA is produced 87, and when appropriate PCR primers are employed 23, 55, 56, 57, as in this study. Besides, stool colonocytes 88 contain much more miRNA ( than that available in free circulation such as in plasma 53, 57, 84. Considerable effort has gone into selecting a reasonable number of miRNA genes (fourteen) from among the many mature human miRNA sequences identified in a previous preliminary microarray data generation study, as a number that can be screened reliably by PCR in a subsequent quantitative dPCR study to ultimately validate smaller panel of miRNA diagnostic screening gene markers, preferably 10 or less, for routine use.
Extraction of Total Small RNA from Stool Samples
We have routinely carried out RNA isolation procedures (both manual and automatic) from colon tissue, blood and stool samples in our labs, manually, as well as by employing the Roche MagNA pure LC™ automated system, using Qiagen’s RNeasy Isolation Kit® from Qiagen, Valencia, CA, containing RLT buffer (a guanidinium-based solution) and other commercial RNA extraction preparations, which provide the advantage of manufacturer’s established validation and quality control standards, increasing the probability of good results 21, 22, 43, 53, 54, 55, 56, 57, to extract high quality total RNA from an environment as hostile as stool; thus, shattering the myth that it is difficult to employ RNA as a screening substrate. The trick has been to stabilize total RNA shortly after obtaining fresh stool by fixing samples in a chaotropic agent (RNALater® (Invitrogen)) and observing that RNA does not ever fragment thereafter. Fragmented RNA results in poor cDNA synthesis and ultimately in less than optimal PCR amplification.
We found total small RNA isolated from stool to be suited for dPCR analysis, without further mRNA purification 87 because: a) purified mRNA involves additional steps, and the increased sensitivity could be balanced by possible loss of material, b) not all mRNA molecules have polyA tail, and c) the concentration of mRNA may be insufficient to allow quality assessment using the Agilent 2100 Bioanalyzer 87. Good human stool preparations showed two sharp ribosomal 18S and 28S rRNA (28S/18S=0.33), with a small fraction of micro RNA and 5S rRNA or tRNA molecules in the Agilent capillary electrophoresis equipment fitted with a RNA 6000 Nano LabChip 22. However, E. coli shows 16S and 23S (23S/16S=1.8) 24. RNA will be quantified spectrophotometrically. Acquiring sufficient small mRNA to analyze from stool or isolated colonocytes is feasible, as each cell contains ~ 20 pg total RNA or 0.4 pg mRNA (equivalent to 0.36 pg ss-cDNA). Only few nanograms of that DNA are needed per PCR reaction] [92].
Reverse Transcription(RT) & Preparation of Single Stranded Copy Deoxy Ribonucleic Acid (ss-cDNA)
An Applied Biosystem kit (the TaqMan® MicroRNA Reverse Transcription Kit) that makes high quality ss-cDNA from total small RNA, and has been employed in earlier studies, will also be used in this study. It uses 50 nM RT primers that bind to the 3’ portion of miRNA molecules, 1x RT buffer, 0.25 mM each of dNTPs, 3.33 U/µl RT in a 7.5 .µl reaction for 30 min at 96oC, 2 min at 56oC, 30 sec at 98oC, 2 min at 60oC and held at 10oC, the chip is then processed, and results expresed in copies µl 48, 50, as shown in the workflow in Figure 3.
Quality Control (QC), and Good Laboratory Practices (GLPs) Procedures
Rigid QC considerations are necessary to ensure the uniformity, reproducibility and reliability of dPCR amplification technology. Compared to real-time quantitative PCR (qPCR), dPCR clearly offers more sensitive and considerably more reproducible clinical methods that could lend themselves to diagnostic, prognostic, and predictive tests. But for this to be realized, the technology will need to be further developed to reduce cost and simplify application. Concomitantly the preclinical research will need be reported with a comprehensive understanding of the associated errors 48, 50.
The term “absolute quantification” used in dPCR refers to an estimate derived from the count of the proportion of positive partitions relative to the total number of partitions and their known volume. When the sample is sufficiently dilute, most partitions will not contain template and those that do are most likely to contain single molecules. As the sample becomes more concentrated, the chance of more than 1 molecule being present within a positive partition increases. This does not pose too great of a challenge, because the distribution of molecules throughout the partitions approximates a Poisson distribution, and a Poisson correction is applied. The dynamic range of a dPCR assay can extend beyond the number of partitions analyzed but the assay precision deteriorates at each end. In contrast, qPCR precision deteriorates only at low copy numbers 50.
dPCR benefits from a far more predictable variance than qPCR, but dPCR is susceptible to upstream errors associated with factors like sampling and extraction. dPCR can also suffer systematic bias, particularly leading to underestimation, and internal positive controls are likely to be as important for dPCR as they are for qPCR, especially when reporting the absence of a sequence. Calibration curves are frequently employed to reduce the error associated with qPCR, but they in turn are challenging to select, value assign, and apply in a manner that will be reproducible; their application also contains inherent error that is almost never considered. Arguably, a key problem with applying qPCR to areas such as the discovery of biomarkers that will eventually be translated to clinical care, is understanding whether poor reproducibility is biological, or if it is due to issues related the fact the qPCR technique is difficult to perform reproducibly. Taking all these arguments in consideration, we are therefore in the opinion that chip-based dPCR is more suited than qPCR in our proposed validation, 5-years study 50. dMIQUE Guidelines have been implement on dPCR data 93. Adopting these guidelines helps to standardize our experimental protocol, maximize efficient utilization of resources, and enhance the impact of this technology. Measuring miRNA by dPCR takes the last 3 months of every study year, after all stool samples have been collected.
Statistical Methods for Validating the MicroRNA Approach
If the difference in gene expression dPCR value in copies/µl between healthy and cancer patients and among the stages of cancer at the end of the proposed validation study is as large and informative for multiple miRNA genes as in the limited preliminary results, suggesting that classification procedures could be based on values exceeding a threshold, then sophisticated classification procedures would not be needed to distinguish between these two groups; otherwise, we will use predictive classification, as detailed below. The goal will be to assign cases to predefined classes based on information collected from the cases. In the simplest setting, the classes (i.e., tumors) are labeled. cancerous and .non-cancerous. Statistical analyses for predictive classification of the information collected (i.e., quantitative PCR results on miRNA genes) attempt to approximate an optimal classifier. Classification can be linear, nonlinear, or nonparametric 94, 95.
The miRNA expression data will be analyzed first with parametric statistics such as Student t-test or analysis of variance (ANOVA) test if the data distribution is random, or with nonparametric Kruskall-Wallis, Mann-Whitney and Fisher exact tests if the distribution is not random 96. If necessary, more complicated models such as multivariate analysis 97 and logistic discrimination will be employed. For the corrected index, cross-validation will be used to protect against overfitting. Efron and Tibshirani 98 suggested dividing the data into 10 equal parts and using one part to assess the model produced by the oter nine; this is repeated for each of the 10 parts. Cross-validation provides a more realistic estimate of the misclassification rate.
The area under the ROC curves, (in which sensitivity is plotted as a function of (1 – specificity)), will be used to describe the trade-off between sensitivity and specificity 99. We will also employ principal component analysis (PCA) method 100, which is a multivariate dimension reduction technique to simplify grouping of genes that show aberrant expression from those not showing expression, or a much reduced expression.
In cases where several genes by themselves appear to offer distinct and clear separation between control and cancer cases in either stool or tissue samples, a PMI 101, 102 may not be needed. If the miRNA gene panel (or a PMI) derived by the end of the study is better than existing screening methods, all of the data generated will be used to assess the model so over-fitting is not a concern.
Cross-validation will be used to protect against over-fitting. The level of gene expression will be displayed using parallel coordinate plots 103, 104, 105 produced by the lattice package in R (version 2.9.0, http://cran.r-project.org) 51. Other packages such as GESS (Gene Expression Statistical System) published by NCSS (www.ncss.com) will also be employed in the study.
Each subject will have his or her medical record number as the key ID for merging various tables in the database. A database will be established using widely available software like MS-Access, which output spreadsheets that will be analyzed with R (version 2.9.0, The R Foundation for Statistical Computing, http://www.r-project.org/) and S-plus software (Insightful Corporation, Seattle, WA).
Results
Accessing Test Performance Characteristics (TPC) of the MiRNA Approach
The copies/µl values of the miRNA gene panel (or a derived microRNA index, PMI) obtained from stool/colonocyte samples of normal subjects and colon cancer patients with high sensitivity and specificity will be compared to the commonly used guaiac FOBT test and with colonoscopy results obtained from patients’ medical records in 180 subjects (30 controls & 150 CC patients) at Study end to access TPC of the microRNA approach.
False positive discovery rates (expected proportion of incorrect assignment among the accepted assignments) will be assessed in our proposed approach by statistical methods 103, 104, 105, as it could reflect on the cost effectiveness of our test. The number of optimal miRNA genes (whether 14 or less) to achieve an optimum miRNAs' gene expression panel is established by appropriate statistics, as detailed below.
Providing Numerical Underpinning of the Method as a Function of Total RNA
Cytological methods on purified colonocytes employing Papanicolaou and Giemsa staining, which showed a sensitivity for detecting tumor cells in smears comparable to that found in biopsy specimens (78.1% versus 83.66%), have been employed 106. A known number of the colonocytes isolated from 1g stool (from normal and neoplastic preparations), extracting total RNA from them to determine the actual amount of total RNA per stool sample, and determining the average copies/µl value from the panel of selected miRNAs from dPCR using the QuantStudioTM 3D Digital PCR Chip instrument will ultimatley give an average value per a certain amount (pg or ng) of total RNA.
Determining a Panel of MiRNA genes, or a Predictive MicroRNA Index (PMI)
If results using a nested case-control design that involves prospective collection of specimens before outcome ascertainment from the study cohort are found to provide a clear cut miRNA expression value, similar to data from the Preliminary Study, one may not need to derive a PMI. It may, however, be necessary to do so if data evaluation dictates the need for that alternative. In this case, the results of the quantitative expression of miRNA genes used to derive the index. Wiley et al. 102, 103 considered 15 genes to derive a mRNA gene expression index for lung cancer, and derived an index defined as the product of two genes divided by the expression of a third gene that was 100% successful in identifying cancerous tissue. Derived reseach data will be used to check the sensitivity and specificity of the index. If the sensitivity falls below 90% or the specificity falls below 95%, forthcoming data using additional miRNA genes may be used with linear or logistic discriminant analysis to refine the index. To determine the usefulness of the PMI as a screening test, the clinical sensitivity (i.e., no or small number of false negatives) and specificity (i.e., no or small numbers of false positives) of the index is used, and a cutoff for a positive or negative index established. All obtained results are classified as either a true positive, false positive, true negative, or false negative by using a two by two matrix (see Table 5 below). The cutoff is defined so that the specificity is at least 95%, and the corresponding sensitivity is expected to be better than current pne (i.e ~ 85%). The relationship between other values of sensitivity and specificity will be described using ROC curves 99. Once results are classified, the clinical sensitivity and specificity of the PMI aree calculated using conventional calculations 107. The positive and negative predictive value are also calculated, although the population being tested will heavily influence these calculations. To measure the clinical utility of gene expression testing as a screening test, the diagnostic sensitivity and specificity of the miRNA gene panel selected, or a derived PMI, are compared to the published sensitivity and specificity of the commonly employed diagnostic screening test, guaiac FOBT, which for over 3 decades in large adenoma averaged < 12%, and in carcinoma averaged ~ 30%, and the specificity averaged ~ 95% 108, 109, 110, 111, and to the gold screening standard colonoscopy results obtained from participants’ medical records that averaged 87% for sensitivity and 100% for specificity 112. The limitations of FOBT are biologically inescapable and cannot be reversed by technological advances 113. Based on our data, we will be able to screen colon cancer, particularly at the pre-malignant stage, with > 90% sensitivity and > 95% specificity, employing 10 miRNA genes in a functional assay, which is better than any available noninvasive test. Thus, a large number of patients will be spared the discomfort, risk and expense of screening colonoscopy. Only those patients truly at risk of having a colon cancer will need to undergo colonoscopy.
Table 5. Predictive MicroRNA Index (PMI)| Cancer Cases Normal Subjects | Tue Positive (TP) | False Negative (FN) |
| False Positive (FP) | True Negative (TN) | |
| % Sensitivity = | TP x 100 TP+FN | % Specificity = TN x 100 FP+TN |
Bioinformatic Methods to Correlate Seed miRNA Data with mRNA Data
To provide information about complex regulatory elements, it is important to correlate miRNA resulting from this study with our mRNA data, which we produced in our earlier published research 22, as well as those data available in the open literature using several computer models (e.g., TargetScan 114. DIANA-micro 115, miRanda 116, PicTar 117, EMBL 118, EIMMo 119, mieWIP 120 or PITA Top 121), each algorithm having its advantages and disadvantages. The authenticity of functional miRNA/mRNA target pair, once identified, will be validated by fulfilling four basic criteria: a) miRNA/mRNA target interaction can be verified, b) the predicted miRNA and mRNA target genes are co-expressed, c) a given miRNA must have a predictable effect on target protein expression (i.e., if a gene is a true target of a given miRNA, its miRNA mimic will decrease the target gene expression level while a miRNA antisense ss-oligonucleotides (ASO) inhibitor will increase the target gene expression level 122), and d) miRNA-mediated regulation of target gene expression should equate to altered biological function 123. To examine the significance of the gene-term enrichment, a modified Fisher exact test EASE score is used to calculate the p-value & Bonferroni criterion employed to correct for multiple hypothesis testing (threshold 0.05), having the human genome as background. MiRNAs are annotated based on their targets identified via miRDB 124. A thermodynamic biomarker discovery approach is to apply Shannon’s mathematical theory of communication encompassing normalized Shannon entropy 125 & Jensen-Shannon divergence 126 to trace the transcriptional changes in CC as the disease progress. Information theory measures allow the identification of biomarkers for progressive and relatively sudden transcriptional changes leading to malignant phenotypes on omics-generated data 127.
Recommended Alternate Methods for Achieving Study Aim
We have proposed the most practical, least labor-intensive and economical approach to accomplish study aims. However, in a few samples (< 5%) in control, pre- or malignant cases, it may be necessary to use methods other than automatic RNA extraction, or dPCR for sample analysis. However, because the error rate is so small and would occur in control and cases, adopting different extraction/analysis methods will not bias results.
Manual Extraction of Rotal RNA from Problematic Samples Using the AGPC Method
In very few samples, inhibitors present in stool may make it difficult to isolate RNA automatically using Qiagen kits that provide the advantage of manufacturer's validation and QC standards, increasing the probability of good results, may not be suitable. In such cases we will manually isolate RNA by a modification of the classical acid guanidinium thiocyanate-phenol-chloroform (AGPC) extraction method 128 using the chaotropic agent guanidinium thiocyanate (GSC) that inactivates ribonucleases and most microorganisms. Only total small RNA samples with an OD 260/280nm ratio from 1.9 to 2.0, and RNA integrity (RIN) on Agilent 2100 BioAnalyzer of > 7.0, may be used .
Use of RT2 focused PCR Arrays to Study miRNA Expression in Conjunction with qPCR System
Qiagen introduced a focused human PCR array in a 96 well plate containing 88 cancer-related miRNA genes, 4 normalization housekeeping synthetic miRNA genes, 2 RT controls and 2 controls to test the efficiency of the dPCR reaction. These focused arrays could be used to study miRNA expression by a universal multiplex qPCR assay using Roche 480 LightCycler PCR instrument, in which a single cDNA preparation can quantitatively assay 88 miRNA genes with high specificity due to the use of universal primers containing a modified oligonucleotide 129.
Use Next Generation Sequencing Technologies (NGS) for MiRNA Profiling (miRNA-seq)
miRNA-seq in more expensive than microarray or qPCR, requires larger amount of total RNA, involves extensive amplification, more time consuming, and is inaccurate estimating miRNA abundance, but it does not require a prior sequence information, allowing identification novel miRNA and miRNA isoforms (isoMirs), distinguish sequentially similar miRNAs, and identify point mutations 130, 131.
Use of a plate Assay to Study MicroRNA Expression
Signosis, Inc., Sunnyvale, CA (www.signosisinc.com) uses high throughput plate assay to monitor individual miRNAs, without the need to carry out a RT reaction. In that assay one of the bridge oligos is partially hybridized with the miRNA molecule and the capture oligo, and another bridge forms a hybrid between the miRNA molecule and the detection oligo. The hybrid is immobilized onto plate through hybridization with an immobilized oligo and detected by a streptavidin-horse radish peroxidase (HRP) conjugate and chemiluminescent substrate using a plate reader. This hybrid structure is sensitive to the sequence of the miRNA molecule. One oligonucleotide difference will prevent the formation of the hybrid and therefore miRNA isoform could be differentiated.
MiRNA Measurements from Exosomes and Microvessicles Extracted from Stool
MiRNAs are resistant to ribonucleases present in stool, probably by inclusion in lipid or lipoprotein complexes in either microvessicles (up to 1 µm), or in small membrane vesicles of endocytic origin known as exosomes (50-100 nm) 132. The mechanism of release of miRNA from exosomes and microvesicles is unclear, although an apoptotic delivery candidate is shed from cells during apoptosis 133. Exosomes released from human and murine mast cell lines were show to contain mRNAs and miRNAs 134. MiRNAs in microvessicles were shown to regulate cellular differentiation of blood cells and certain metabolic pathways, and to modulate immune functions 135.
MiRNA signatures of tumor-derived exosomes were shown to function as diagnostic markers in ovarian cancer, and tumor-derived miRNA profiles and profiles of exosomal miRNAs were not significantly different 30. If necessary, exosomal miRNAs extracted from stool colonocytes by differential centrifugation, followed by filtration through 0.22 µm filters, total RNA extracted by Trizol & concentration measured at λ 280 134.
Use of Real-Time qPCR to Study MicroRNA Expression
dPCR has the edge over qPCR with the respect to technical reproducibility, because the digital output derived from diluting the sample essentially counts the number of molecules, which is far more reproducible than the analog Cq output offered by qPCR that potentially improves both quantitative and qualitative molecular measurements.
One key advantage of qPCR, however, is it being readily scalable. Consequently, although dPCR has the potential to be more sensitive than qPCR when sample volumes are matched, qPCR will have the edge if sensitivity can be improved by performing a larger-volume reaction 136.
Conclusions
Quantitative Milestones Expected to be Accomplished by the End of the Research
The following three milestones are expected to be achieved by the end of proposed research to judge success:
Milestone 1
Derive a workable miRNA gene panel, or a PMI in stool indicative of premalignant & malignant conditions using total small RNA extracted from stool of 150 CC patients and 30 control subjects.
This milestone is achieved, if ≥ 114 (95%) of the patients with cancer have a miRNA panel that gives numerical pre- and malignant copies/µl values in stool by QuantStudioTM 3D Digital PCR System.
Milestone 2
Access TPC & Provide numerical underpinning of the method as a function of total RNA
Test performance characteristics (TPC) of the miRNA approach are determined by comparing copies/ul values of the miRNA gene obtained from stool samples of normal subjects and colon cancer patients with guaiac FOBT test and with colonoscopy results obtained from patients’ medical records on the 150 subjects. A numerical underpinning of the method are determined by calculating the amount of total small RNA in 1 g of stool, and determining the average copy/ul value for the miRNA gene per a known amount (pg or ng) of total RNA.
Milestone 3
Establish the clinical sensitivity and specificity of the miRNA gene panel, or a PMI, using total small RNA extracted from stool of 180 subjects (30 controls and 150 with pre- and malignant CCs)
This Milestone is Carried out as Follows:
Guaic FOBT (Hemoccult II Sensa, Beckman Coulter, Fullerton, CA). standardized at research facility is performed in parallel with the miRNA panel for each stool sample obtained from the 30 normal & 150 colon cancer.
Colonoscopy results, which are considered as the “Gold Standard” for CRC screening, are reviewed by Gastro-enterologists, as well as blindly checking histopathologic results of biopsies/surgical specimens and final patients’ diagnosis, including those carried out on polyp biopsies, if removed, as obtained from patients’ medical records.
Using the copies/ul results from the panel of genes selected (or a PMI) obtained from stool samples of normal, and from stool samples of cancer patients, a 2 x 2 tables (see Predictive MiRNA Index, Table 5) is constructed to determine the clinical sensitivity and specificity of the microRA assay from miRNAs stool specimens' results.
The calculated sensitivity/specificity of the miRNA assay is compared to the FOBT assay in all the 180 subjects assessed in the same laboratory by the same investigators, as well as colonoscopy results obtained from patients’ medical records, to establish TPCs. If the results are at least as specific as the FOBT (95%) and the sensitivity ≥95%, which exceeds colonoscopy, then this milestone will have been successfully achieved.
References
- 1.Ahmed F E. (2007) The role of microRNA in carcinogenesis and biomarker selection: a methodological perspective. , Exp Rev Mol Diag 7, 569-603.
- 2.Kozomara A, Griffiths-Jones S. (2018) miRBase: annotating high confidence microRNA using deep-sequencing data. , Nucleic Acids Res 43.
- 3.Reinhart B J, Slack F J, Basson M, Pasquinell A E, Bettinger J C. (2000) RNA regulates developmental timing in Caenorhabditis elegans. Rougvie AE, Horvitz HR and Ruvkun G: , Nature 403, 901-906.
- 4.Xu P, Guo M, Hay B A. (2004) MicroRNAs and the regulation of cell death. , Trend Genet 20, 617-624.
- 6.Cummins J M, Velculescu V E. (2006) Implication of microRNA profiling for cancer diagnosis. , Oncogene 15, 6220-6227.
- 7.Lee E J, Gusev Y, Jiang J, Nuovo G J, Lerner M et al. (2007) Expression profiling identifies distinct microRNA signature in pancreatic cancer. , Int J Cancer 120, 1046-1054.
- 8.Yanaihara N, Caplen N, Bowman E, Seike M, Kumamoto K et al. (2006) Unique microRNA molecular profiles in lung cancer diagnosis and prognosis. Groce CM and Harris CC , Cancer Cell 9, 189-198.
- 9.Iorio M V, Ferracin M, Liu C G, Veronese A, Spizzo R et al. (2005) MicroRNA gene expression deregulation in human breast cancer. , Cancer Res 65, 7065-7070.
- 10.Cummins J M, He Y, Leary R J, Pagliarini R, Diaz LA Jr et al. (2006) The colorectal microRNome. Proc Natl Acad Sci USA 103: 3687-3692.
- 11.Calin G A, Ferracin M, Cimmino A, Dileva G, Shimiz M et al. (2005) A microRNA signature associated with prognosis and progression in chronic lymphocytic leukemia. , N Eng J Med 353, 1793-1801.
- 12.Eis P S, Tam W, Sun L, Chadburn A, Li Z et al. (2003) . Accumulation of miR-155 and BIC RNA in human B cell lymphomas. Proc Natl Acad Sci USA 102: 3627-3632.
- 14.Calin G A, Sevignai C, Dumitru C D, Hyslop T, Noch E et al. (2004) Human microRNA genes are frequently located at fragile sites and genomic regions involved in cancers. , Proc Natl Acad Sci USA 101, 2999-3004.
- 15.Schepler T, Reinert J T, Oslenfeld M S, Christensen L L, Silahtaroglu A N et al. (2008) Diagnostic and prognostic microRNAs in Stage II colon cancer. , Cancer Res 68, 6416-6424.
- 16.Barbarotto E, Schmittgen T D, Calin G A. (2008) MicroRNAs and cancer: Profile, profile, profile. , Int J Cancer 122, 969-977.
- 17.Schetter A J, Leung S Y, Sohn J J, Zanetti K A, Bowman E D et al. (2008) MicroRNA expression profile associated with progression and therapeutic outcome in colon adenocarcinoma. , J Am Med Assoc 299, 425-436.
- 19.Lu J, Getz G, Miska E A, Alvarez-Saavedra E, Lamb J et al. (2005) MicroRNA expression profiles classify human cancers. , Nature 435, 834-838.
- 20.Oberg A L, French A J, French A J, Sarver A L, Subramanian S et al. (2011) MiRNA expression in colon polyps provide evidence for a multihit model of colon cancer. Steer CJ and Thibodeau SN , PLoS ONE 6, 20465.
- 21.Ahmed F E. (2007) Colon cancer epigenetics: The role of environmental factors and the search for molecular biomarkers. , J Env Sci Health 25, 75-130.
- 22.Ahmed F E, Vos P, iJames S, Lysle D T, Allison R R et al. (2007) Transcriptomic molecular markers for screening human colon cancer in stool & tissue. , Cancer Genom Proteom 4, 1-20.
- 23.Ahmed F E, Jeffries C D, Vos P W, Flake G, Nuovo G J et al. (2009) Diagnostic microRNA markers for screening sporadic human colon cancer and ulcerative colitis in stool and tissue. , Cancer Genom Proteom 6, 281-296.
- 24.F Di Cello, Xie Y, Paul-Satyaseela M, Kim K S. (2005) Approaches to bacterial RNA isolation and purification for microarray analysis of Escherichia coli K1 interaction with human brain microvascular endothelial cells. , J Clin Microbiol 43(8), 4197-4199.
- 25.Morikawa T, Kato J, Wada R Yamaji, Miksushima T, Shiratori Y. (2006) Comparison of the immunochemical fecal occult blood test and total colonoscopy in the asymptomatic population. , Gastroenterology 125, 422-428.
- 26.Koga Y, Yasunaga M, Katayose S, Moriya Y, Akasu T et al. (2008) Improved recovery of exfoliated colonocytes from feces using newly developed immunoparamagnetic beads. Gastroenterol Res Practice doi-10.1155/2008/605273.
- 27.Davies R J, Miller R, Coleman N. (2005) Colorectal cancer screening: prospects for molecular stool analysis. , Nature Rev Cancer 5, 199-209.
- 28.. CentersforDisease Control and Prevention(2006)Increased use of colorectal cancer test:United States,2002 and 2004.MMWR Mortal Wkly 55, 208-311.
- 29.Peterson N B, Murff H J, Ness R M, Dittus R S. (2007) Colorectal cancer screening among men and women in the United States. , J. Womens Health 16, 57-65.
- 30.Valadi H, Elkstrom K, Bossios A, Sjostrand M, Lee J J et al. (2007) Exosome mediated transfer of mRNAs and microRNAs is a novel mechanism of genetic exchange between cells. , Nat Cell Biol 9, 654-659.
- 31.M S Pepe, Feng Z, Janes H, Bossuyt P M, Potter J D. (2008) Pivotal evaluation of the occurance of a biomarker used for classification or prediction: standards for study design. of Cancer. , J Natl Cancer Inst 100, 1432-1438.
- 32.Lindblom A. (2001) Different mechanisms in the tumorigenesis of proximal and distal colon cancers. , Curr Opin Oncol 13, 63-69.
- 33.Konishi K, Fujii T, Boku N, Kato S, Koba I et al. (1999) Clinicopathologicaldifferences between colonic and rectal carcinoma:are they based on the same mechanisms of carcinogenesis.Gut 45. 818-821.
- 34.Green J, Watson J, Roche M, Beral V, Patnick J. (2007) Stage, grade and morphology of tumors of the colon and rectum recorded in the Oxford Cancer Registry. , Br J Cancer 96, 140-142.
- 35.Meyer J E, Narang T, Schnoll-Sussman F H, Pochapin M B, Christos P J et al. (2010) Increasing incidence of rectal cancer in patients aged younger than 40 years: an analysis of the surveillance, epidemiology, and end results database. , Cancer 116, 4354-4359.
- 36.Frattini M, Balestra D, Suardi S, Oggionni M, Alberici P et al. (2004) Different genetic features associated with colon and rectal carcinogenesis. , Clin Cancer Res 10, 4015-4021.
- 37.Minoo P, Zlobec I, Peterson M, Terracciano L, Lugli A. (2010) Characterization of rectal, proximal and distal colon cancer based on clinicopathological, molecular and protein profiles. , Int J Oncol 37, 707-718.
- 38.Slattery M L, Curtin K, Wolff R K, Boucher K M, Sweeney C et al. (2009) A comparison of colon and rectal somatic DNA alterations. , Dis Colon Rectum 52, 1304-1311.
- 39.He Q J, Zeng W F, Sham J S. (2003) Recurrent genetic alterations in 26 colorectal carcinomas and 21 adenomas from Chinese patients. , Cancer Genet Cytogenet 144, 112-118.
- 40.Aamodt R, Jonsdottir K, Andersen S N, Bondi J, Bukholm G et al. (2009) Differences in protein expression and gene amplification of cyclins between colon and rectal adenocarcinomas. Gastroenterol Res Pract. 785-830.
- 41.Ahmed F E. (2006) Microarray RNA transcriptional profiling: Part I. Platforms, experimental design and standardization. , Exp. Rev. Mol. Diag 6, 535-550.
- 42.Ahmed F E. (2006) Microarray RNA transcriptional profiling: Part II. Analytical considerations and annotations. , Exp Rev Mol Diag 6, 736-750.
- 43.Ahmed F E, Vos P W, Jeffries C, Wiley J, Weidner D A et al. (2009) Differences in mRNA and microRNA expression profiles in human colon adenocarcinoma HT-29 cells treated with either intensity-modulated radiation therapy (IMRT), or conventional radiation therapy (RT). , Cancer Genom Proteom 6, 109-128.
- 44.Schroeder A, Mueller O, Stocker S, Salowsky R, Leiber M et al. (1993) The RIN: an RNA integrity number for assigning integrity values to RNA measurements. , BMC Molecular Biology.Doi-10.1186/1471-2199-7-3 7(1), 3.
- 45.Fleige S, M W Pfaffl. (2006) RNA integrity and the effect on the real-time qRT-PCR performance. Molecular Aspects of Medicine.http://doi.org/10.1016/j.mam.2005. 27(23), 126-39.
- 46.Bevilacqua C, Makhzami S, Helbling J-C, Defrenaix P, Martin.P (2010).Maintaining RNA integrity in a homogeneous population of mammary epithelial cells isolated by Laser Capture Microdissection. , BMC Cell Biology.Doi-10.1186/1471-2121-11-95 11(1), 95.
- 47. (2016) . , RNA Integrity Number (RIN) – Standardization of RNA Quality Control", Agilent Application Note, Publication Number 5989-1165.
- 48.Miotto E, Saccenti E, Callegari E, Negrini M, Ferracin M. (2014) Quantification of circulating miRNAs by droplet digital PCR: comparison of EvaGreen- and TaqMan-based chemistries.Cancer Epidemiol Biomarkers Prev.Doi-10.1158/1055-9965. 23(12), 2638-42.
- 49.Hindson B J, Ness K D, Masquelier D A, Belgrader P, Herida N J.Makareviez AJ et al (2011) High-tghroughput droplet digital PCR System for absolute Quantification of DNA copy number. , Anal Chem 83, 8604-8610.
- 50.Conte D, Verri C, Borzi C, Suatoni P, Pastorino U et al. (2015) Novel method to detect microRNAs using chip-based QuantStudio 3D digital PCR. , BMC Genomics.DOI-10.1187/s12864-015-2097-9 16, 849-849.
- 51.Core R. (2017) Team R: A language and environment for statistical computing. R Foundation for Statistical Computing. , Vienna, Austria. URL https://www.R-project.org/
- 53.F E Ahmed, N C Ahmed, Gouda M, P W Vos. (2017) MiRNAs for the Diagnostic Screening of Early Stages of Colon Cancer. in Stool or Blood. Surgical Case Reports and Reviewss 1(1), 1-19.
- 54.Ahmed F, E. (2014) miRNA as markers for the diagnostic screening of colon cancer. Expert Rev AnticancerTher.Doi-10.1586/14737140.2014.869479. 14(4), 463-485.
- 55.F E Ahmed, N C Ahmed, Gouda M, Bonnerup C. (2017) MicroRNAs as Molecular Markers for Screening of Colon Cancer. Insights Biol Med (In Press).Case Rep Surg Invasive. Proceedings 1(2), 14-17.
- 56.F E Ahmed, N C Ahmed, M C Gouda, Bonnerup C. (2017) MicroRNA as molecular markers for screening of colon cancer. Case Reports Surg Invasive Procedures. 1(2), 14-15.
- 57.F E Ahmed. (2017) MicroRNAs as Molecular Markers for Colon Cancer Diagnostic Screening. in Stool & Blood. Int Med Rev.doi-10.3390/cancers9090124. 9(124) .
- 58.Winter M J, Nagtegaal I D, van Krieken JH, Litvinov S V. (2003) The epithelial cell adhesion molecule (Ep-CAM) as a morphoregulatory molecule is a tool in surgical pathology. , Am J Pathol 163, 2139-2148.
- 59.Matsushita H M, Matsumura Y, Moriya Y, Akasu T, Fujita S et al. (2005) A new method for isolating colonocytes from naturally evacuated feces and its clinical application to colorectal cancer diagnosis. , Gastroenterology 129, 1918-1927.
- 60.Traverso G, Shuber A, Levin B, Johnson C, Olsson L et al. (2002) Detection of APC mutations in fecal and DNA from patients with colorectal tumors. , N Engl J Med 346, 311-320.
- 61.Lenhard K, Bommer G T, Asutay S, Schauer R, Brabletz T et al. (2005) Analysis of promoter methylation in stool: a novel method for the detection of colorectal cancer. , Clin Gastroenterol Hepatol 3, 142-149.
- 62.Itzkowitz S H, Jandorf L, Brand R, Rabeneck L, S et al. (2007) Improved fecal DNA test for colorectal cancer screening. , Markowitz S and Shuber A 5, 111-117.
- 63.Imperiale T F, Ransohoff D F, Itzkowitz S H, Turnbull B A, Ross M A. (2004) Fecal DNA versus fecal occult blood for colorectal cancer screening in an average-risk population. , New Eng J Med 351, 2704-2714.
- 64.Cairns R, Sidaransky D. (1999) Molecular methods for diagnosis of cancer. , Biochim Biophys Acta 1423, 11-18.
- 65.Ahmed F E. (2009) Liquid chromatography-mass spectrometry: A tool for proteome analysis & biomarker discovery and validation. , Exp Opin Mol Diag 3, 429-444.
- 66.Greenbaum D, Colangelo C, Williams K, Gerstein M. (2003) Comparing protein abundance and mRNA expression levels on a genomic scale. , Genome Biol 4, 117-126.
- 67.Ahmed F E. (2006) Expression microarray proteomics and the search for cancer biomarkers. , Curr Genom 7, 399-424.
- 68.Rifai N, Gillette M A, Carr S A. (2006) Protein biomarker discovery and validation: the long and uncertain path to clinical utility. , Nature Biotechol 24, 971-983.
- 69.Ransohoff D F, Martin C, Wiggins W S, Hitt B A, Keku T O et al. (2008) Assessment of serum proteomics to detect large colon adenomas. , Cancer Epidemiol Biomarkers Prev 17, 2188-2193.
- 70.Baek D, Villén J, Shin C, Camargo F D, Gygi S P et al. (2008) The impact of microRNA on protein output. , Nature 455, 64-71.
- 71.Selbach M, Schwarheuser B, Thierfelder N, Fang Z, Khanin R et al. (2008) Widespread changes in protein synthesis induced by microRNAs. , Nature 455, 58-63.
- 72.Lanza G, Ferracin M, Gafa R, Veronese A, Spizzo R et al. (2007) mRNA/microRNA gene expression profile in microsatellite unstable colorectal cancer. , Mol Cancer 6, 54.
- 73.Barbarotto E, Schmittgen T D, Calin G A. (2008) MicroRNAs and cancer: Profile, profile, profile. , Int J Cancer 122, 969-977.
- 74.Shi B, Stepp-Lorenzino L, Prisco M, Linsley P, deAngelis T et al. (2007) MicroRNA145targets the insulin receptor substrate-1 and inhibits the growth of colon cancer cells.J. , Biol Chem 282, 32582-32590.
- 75.Michael M Z, O’Connor S M, NG van Holst Pellekaan, Young G P, James R J. (2003) Reduced accumulation of specific microRNAs in colorectal neoplasia. , Mol Cancer Res 1, 882-891.
- 76.Lu M, Zhang Q, Deng M, Miao J, Guo Y et al. (2008) An analysis of human microRNA and disease associations. PLoS ONE 3: e3420.
- 77.Chen X, Ba Y, Ma L, Cai X, Yin Y et al. (2008) Characterization of microRNAs in serum: a novel class of biomarkers for diagnosis of cancer and other diseases. , Cell Res 18, 997-1006.
- 78.News RNAi. (2009) Rosetta Genomics aims to launch blood-based miRNA colon cancer test in 2010. RNAi News. , March10,2009,17
- 79.Davidson L A, Lupton J R, Miskovsky E, Fields A P, Chapkin R S. (2003) Quantification of human intestinal gene expression profiling using exfoliated colonocytes: a pilot study. , Biomarkers 8, 51-61.
- 80.Jorgensen O D, Kronborg O, Fenger C. (2002) A randomized study of screening for colorectal cancer using faecal occult blood testing: results after 13 years and seven biennial screening rounds. , Gut 50, 29-32.
- 81.Link A, Balaguer F, Shen Y, Nagasaka T, Lozano J J et al.CR and Goel A (2010)Fecal microRNAs as novel biomarkers for colon cancer screening.Cancer Epidemiol Biomarkers Prev. 19, 1766-1774.
- 82.F E Ahmed. (2014) Role of microRNA molecules in colon cancer etiology.doi.org/10.4172/0974-8369.1002d.83.Biol.Med. 6-2.
- 83.F E Ahmed, N C Ahmed, P W Vos, Bonnerup C, J N Atkins et al. (2013) Diagnostic microRNA markers to screen for sporadic human colon cancer in stool: I. Proof.
- 84.Ahmed F E, Ahmed N C, Vos P W, Bonnerup C, Atkins J N et al. (2012) Diagnostic microRNA markers to screen for sporadic human colon cancer in blood. , Cancer Genom Proteom 9, 179-192.
- 85.Ahmed F E, Ahmed N C, Gouda M, Vos P W, Bonnerup C. (2018) RT-qPCR for fecal micro RNA Quantification and Validation. , Methods Mol Biol 1765, 203-2015.
- 86.F E Ahmed, Nancy C Ahmed, C N.. M.(2017) Use of MicroRNAs to Screen for Colon Cancer. Colon and Rectal Surgery: Clinics in Surgery 2, 1-18.
- 87.Panaro N J, Yuen P K, Sakazume T, Fortina P, Kricka L J et al. (2000) Evaluation of DNA target sizing and quantification by the Agilent 2100 Bioanalyzer. , Clin Chem 46, 1851-1853.
- 88.Duke S, Yan I K, Lohray R, Patel T. (2018) Droplet digital PCR for quantification of extrcellular RNA. , Methods Mol Biol 1740, 155-162.
- 89.Dube S, Qin J, Ramakrishnan R. (2008) Mathematical analysis of copy number variation in a DNA sample using digital PCR on a nanofluidic device. PLoS One 23:e2876.
- 90.Ahmed F E, Ahmed N C, Gouda M A. (2017) RT-qPCR for fecal mature microRNA quantification. In Role of microRNA in Diseases. Ed. M Beaulieu,Springer Verlag , New York/Berlin .
- 91.Hayden R T, Gu Z, Ingersoll J, Abdul-Ali D, Shi L et al.and Caliendo AM(2013) Comparison of droplet digital PCR to real-time PCR for quantitative detection of cytomegalovirus. , J Clin Microbiol 51, 540-546.
- 92.Kuecker S J, Jin L, Kulig E, Oudrago G L, Roche P C et al. (1999) Analysis of PRL, PRL-R, TGFb1, and TGFb-RII gene expression in normal neoplastic breast tissue after laser capture microdissection. , Appl Immunol Molec Morph 7, 193-200.
- 93.Huggett J F, Fot C A, Emsile K, Garson J A, Heypes R et al. (2013) The MIQUE guidelines: Minimum information for publication of quantitative digital PCRapproach. , Clin Chem 59, 892-901.
- 94.Kraemer H C. (1992) Evaluating Medical Tests: Objective and Quantitative Guidelines. Sage Publications. , Newsburry Park, California
- 95.Ripley. (1997) Classification. InEncyclopedia of Statistical Sciences. , Vol.1, Wiley-Interscience Publication, NY
- 96.D S Moore, G P McCabe, Craig B. (2009) Introducrion to the Practice of Statistics, 6th edition.W.H. Freeman & Company,St. , Louis, MO
- 97.C Y Nagan, Yamamoto H, Seshimo I, Ezumi K, Terayama M et al. (2007) A multivariate analysis of adhesion molecules expression in assessment of colorectal cancer. , J Surg Oncol 95, 652-662.
- 98.Efron B, Tibshirani R J. (1993) An introduction to the Bootstrap. Chapman and Hall. , New York, NY
- 99.Hanley J A, McNeil B J. (1982) The meaning and use of the area under a receiver operating characteristic (ROC) curve. , Radiology 143, 29-36.
- 100.Wegman E. (1990) Hyperdimensional data analysis using parallel coordinate. , J Am Stat Assoc 85, 644-675.
- 101.Willey J C, Crawford E L, Jackson C M, Weaver D A, Hoban J C et al. (1998) Expression measurement of many genes simultaneously by quantitative RT-PCR using standardized mixtures of competitive templates. , Am J Resp Cell Mol Biol 19, 6-17.
- 102.DeMuth J P, Jackson C M, Weaver D A, Crawford E L, Durzinsky D S et al. (1998) The gene expression index cmyc x E2F-1/p21 is highly predictive of malignant phenotype in human bronchial epithelial cells. , Am J Respir Cell Mol Biol 19, 18-29.
- 104.Tang Y.Ghosal S and Roy A (2007)Nonparametric Bayesian estimation of positive false discovery rates.Biometrics 63:. 1126-1134.
- 105.Choi H, Nesvizhskii A I. (2008) False discovery rates and related statistical concepts in mass spectrometry-based proteomics. , J Proteome Res 7, 47-50.
- 106.Koss L G, Melamed M R, Eds. (2005) . Koss’ Diagnostic Cytology and Histopathologic Bases, 5th edition , Lippincott, Williams .
- 107.Burtis C A, Ashwood E R. (1994) Tietz Textbook of Clinical Chemistry.W.B.Saunders Co. , Philadelphia, Pennsylvania
- 108.Ahlquist D A. (1997) Fecal occult blood testing for colorectal cancer. Can we afford to do this?. , Gastroenterol Clin N Am 26, 41-55.
- 110.Allison J E, Tekawa I S, Ransom L J, Adrian A L. (1996) A comparison of fecal occult blood tests for colorectal cancer screening. , N Engl J Med 334, 155-159.
- 111.Allison J E, Sakoda L C, Levin T R, Tucker J P, Tekawa I R et al. (2007) Screening for colorectal neoplasms with new fecal occult blood tests: update on performance characteristics. , J Natl Cancer Inst 99, 1462-1470.
- 112.Bressler B, Paszat L F, Vinden C, Li C, He J et al. (2004) Colonoscopic miss rates for right-sided colon cancer: population-based study. , Gastroenterology 127, 452-456.
- 113.Osborn N K, Ahlquist D A. (2005) Stool screening for colorectal cancer: molecular approaches. , Gastroenterology 128, 192-206.
- 114.Bruce CB LewisBF, Bartel D F. (2005) Conserved seed pairing, often flanked by adenosines, indicates that thousands of human genes are microRNA targets. , Cell 120(1), 15-20.
- 115.Kiriakidou M, Nelson P T, Kouranov A, Fitziev P, Bouyiokos C.Mourelatos Z and Hatzigeorgiou A (2004)A combined computational-experimental approach predicts human microRNA targets. , Genes Dev 18, 1165-1178.
- 116.John B B, Enright A J, Aravin A, Tuschl T, Sander C et al. (2004) Human microRNA target. , PloS Biol 2, 363.
- 117.Krek A, Grun D, Poy M N, Wolf R, Rosenberg L et al. (2005) Combinational microRNA target predictions. , Nature Genet 37, 495-500.
- 118.Stark A, Brennecke J, Bushati N, Russell R B, Cohen S M. (2005) Animal microRNAs confers robustness to gene expression and have a significant impact on 3’UTR evaluation. , Cell 123, 1133-1146.
- 119.Gaidatzis D, E van Nimwegan, Hausser J, Zavolan M. (2007) Inference of miRNA targets using evolutionary conservation and pathway analysis. , BMC Bioinformatics 8, 69.
- 120.Hammel M, Long D, Zhang L, Lee A, Carmack C S et al. (2008) mirWIP: microRNA target prediction based on microRNA-containing ribonucleoprotein-enriched transcripts. , Nat Methods 9, 813-819.
- 121.Kertesz M, Iovino N, Unnerstall U, Gaul U, Segal E. (2007) The role of site accessibility in microRNA target recognition. , Nat Genet 39, 1278-1284.
- 122.Schratt G M, Tuebing F, E A Nigh, Kane C G, Sabatini M E et al. (2006) A brain-specific microRNA regulates dendritic spine development. , Nature 439, 283-289.
- 123.Kuhn D E, Martin M M, Feldman D S, Terry AV Jr, Nuovo G J et al. (2008) Experimental validation of miRNA targets. , Methods 44, 47-54.
- 124.Wang X. (2008) miRDB: a microRNA target prediction and functional annotation database with a wiki interface. , RNA 14, 1012-1017.
- 125.Lamberti P W, Martin M T, Plastino A.Rosso OA (2004)Intensive entropic non-triviality measure.Physics A: Statistical Mechanisms Applications. 334, 119-131.
- 126.Grosse I, Bernaola-Galvan P, Carpena P. (2002) Analysis of symbolic sequences using the Jensen-Shannon divergence. , Phys Rev E Stat Nonlin Soft Matter Phys 65, 041905.
- 127.Berretta R, Moscato P. (2010) Cancer biomarker discovery: the entropic hallmark. , PLoS ONE 5, 12262.
- 128.Chomezynski P, Sacchi N. (1987) Single-step method of RNA isolation by acid guanidinium thiocyanate-phenol-chloroform extraction. , Anal Biochem 162, 156-159.
- 129.Wang Y, Kim D, Gibbons J, Zeng X, Pang L et al. (2012) . , City, CA, miRNA PCR Arrays, SA Biosciences, Applied Biosystems,Foster
- 130.Git A, Dvinge H, Salmon-Divon M, Osborne M, Kutter C et al. (2010) Systematic comparison of microarray profiling, real-time PCR, and next-generation sequencing technologies for measuring differential microRNA expression. , RNA 16(5), 991-1006.
- 131.Margulies M.EnghlomM,Altman W et al (2005) Genome sequencing in mixrofabricated high-density picoliter reactors. , Nature 437, 376-380.
- 132.Kosaka N, Iguchi H, Ochiyn T. (2010) Circulating microRNA in bodyfluid: a new potential biomarker for cancer diagnosis and prognosis. , Cancer Sci 101, 2087-2092.
- 133.Zernecke A, Bizhekov K, Noel H, Shagdarsura E, Gan L et al.Weber C (2009)Delivery of microRNA-126 by apoptotic bodies includes CXCL12-dependent vascular protection.Sci. , Signal 2, 81.
- 134.Hunter M P, Ismail N, Zhang X, Aguda B D, Lee E J et al. (2008) Detection of microRNA expression in human peripheral blood microvesicles. , PLoS ONE 3, 23694.
Cited by (5)
This article has been cited by 5 scholarly works according to:
Citing Articles:
Cancers (2025) OpenAlex Crossref Semantic Scholar
Diagnostics (2024) OpenAlex Crossref
Frontiers in Pharmacology (2023) OpenAlex Crossref Semantic Scholar
Medical Oncology (2023) OpenAlex Crossref Semantic Scholar
Frontiers in Molecular Biosciences (2020) OpenAlex Semantic Scholar