
Abstract
A field study was undertaken along six diverse habitat gradients of Kenya to evaluate the occurrence and underlining drivers that shape meliponine bee species diversity. These gradients ranged from continuous forest habitats (Indigenous forests, mixed forests and exotic forest patch) representing unfragmented habitats to dispersed habitats (Mixed deciduous woodlands, Grasslands dominated by perennial grasses such as Cenchrus ciliaris, Chloris roxburghiana and Acacia dominated bush lands) representing fragmented habitats respectively.
A total of four different species of meliponine bees were encountered with Hypotrigona gribodoi being the most abundant species, followed by Meliponula ferruginea (black), Plebeina hildebrandti and Hypotrigona ruspolii in descending order. Occurrence and diversity of Hypotrigona gribodoi, Melipona ferruginea (black), Plebeina hildebrandti and Hypotrigonaruspolii was significantly influenced by the degree of fragmentation (vegetation type) and floral diversity (P = 0.0056); the mean number of colonies recorded per study site ranged from 2.3 in dispersed habitats in the lowlands to 1.0 in continuous forest landscapes in the highlands, whereas the mean population density ranged from 2.0 to 172 colonies/25 ha-transects.
The results provide substantial support to better understand interactions between habitat structure and the degree of fragmentation in linking species diversity to habitat loss.
Author Contributions
Academic Editor: AM Chen Chenming, China
Checked for plagiarism: Yes
Review by: Single-blind
Copyright © 2019 Bridget O. Bobadoye
 This is an open-access article distributed under the terms of the Creative Commons Attribution License, which permits unrestricted use, distribution, and reproduction in any medium, provided the original author and source are credited.
Competing interests
The authors have declared that no competing interests exist.
Citation:
Introduction
Insect pollinators are the most important providers of ecosystem services globally 16 with an estimated 20,000-30,000 species worldwide; as they are also important indicators of biodiversity. They have co-evolutionary relationships with plants and therefore their services are inevitable for the maintenance of the life cycles of many plant species 17.
The structure of bee communities is closely related to the floral communities they forage upon with several key characters already identified, including floral diversity (Tepedino and Stanton, 1981; Gathmann and Tscharntke, 2002),18 floral abundance 6 and seasonal availability of these resources 15. Up until recently, some studies have attempted to quantify the combined effect of other structuring agents to the diversity of pollinators within a specified habitat 13. Such drivers have been identified to impact directly upon insect pollinator communities, while others impact indirectly through the modification and compositioning of floral communities or other forms of habitat structure. Bees are known to exhibit a diverse array of nesting strategies with respect to the type of habitat they are naturally occuring in, type of nesting substrate used, and the materials required for nest construction making them easily partitioned into several exclusive guilds on the basis of their nesting habitats 13.
While forage rewards provided by floral communities are generally accepted as the primary determinant of pollinator community structure, there is an increasing body of evidence suggesting that habitat structure may also play an important role in the occurrence of endemic pollinators such as meliponine bee diversity within any habitat 21.
It is widely acknowledged that habitat loss has negative effects on biodiversity and that the quality of suitable habitat in any landscape enhances species diversity. The effect of habitat fragmentation and isolation ranges on diversity of insect pollinators is less clear. Increasing isolation from naturally ideal habitats can be associated with either a decline or an increase in species composition, richness and diversity.
Material and Methods
Site Description
The Eastern Arc mountains has the status of a global biodiversity hot-spot (Pellikka et al., 2013; Adriaensen et al., 2006)1 and it lies in south-eastern Kenya at 03o20 S, 38o15 E, about 150 km inland from the coast and covering an area of about 250 km22(Figure 1). The hills are isolated from other mountainous areas viz the south-east (Shimba Hills), south (Usambara Mountains), south-west (Mt Kilimanjaro), west (Ngulia and Chyulu Hills) and the north-west (Kenyan highlands) by the vast plains of Tsavo 9. The annual rainfall is characterized by two rainy seasons (March- May, September – October) and varies between 480 and 1200 mm in the highlands 14, but much less rainfall (250 mm) (Figure 2) is observed on the surrounding plains of the sparse lowlands 11.
Figure 1.Map of Taita hills forests and surrounding area showing the data collection sites.
Figure 2.Mean rainfall in the eastern arc mountains.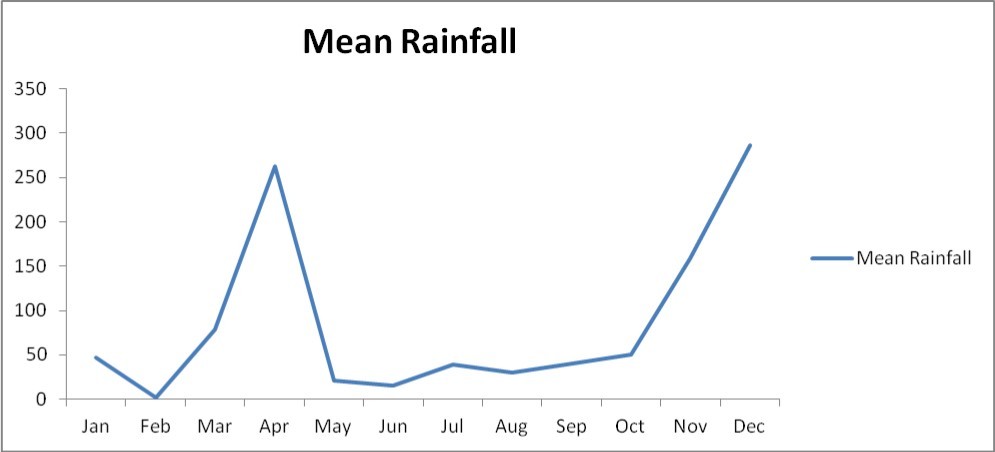
Habitat Features
Sparse Lands
The eastern arc mountains are characterized by highly dispersed vegetation and fragmented habitats dominated by dry grassland plains (Table 1). The mean rainfall in the lowlands ranges around 400 mm with peaks in April and November every year.
Table 1. Summary of site locations and habitat area.| Site code | Coordinates | Ecological zone | Location |
|---|---|---|---|
| MDW | 3.26086oS/38.26525oE | Woodlands | Lowlands |
| GL | 3.46000oS/38.36528oE | Grasslands | Lowlands |
| ADBL | 3.37269oS/38.42814oE | Bush lands | Lowlands |
| IMF | 3.41875oS/38.36939oE | Indigenous forest | Highlands |
| EFP HCH | 3.36208oS/38.33072oE3.46612oS/38.35899oE | Exotic forestMixed forest | HighlandsHighlands |
Vegetation is characterized by mixed commiphora deciduous woodlands in Msau, which are widely dispersed, but a considerable number of mature deciduous trees have been reduced to shrubs by extensive grazing and deforestation. Common deciduous trees such as Albizia gummifera G., Haplocoelum foliolosum Terminalia sinensis H., Terminalia sinensis L., Comiphora schimperi O., Balanites pedicelaris Mildbr., Tamarindus indica L., Sterculia Africana (Liour.), Ficus sycomorus L., and Cordia sinensis Lam. are majorly found along streams. 12.
The grasslands consisting mainly of perennial grasses such as Chloris roxburghiana Scult, Cenchrus ciliaris, Erythrococca bongensis Pax, Pennisetum menzianum Lee and also Setaria sphacelata (Schumach.) Common shrubs included Crotondichogamous Pax, Ocimum kilimadischaricum Guerke. Undergrowth is minimal with bare soil surface exposure clearly evident. With increased regional slope, large gully systems are rapidly formed and have rendered the land unproductive for agriculture.
The Acacia dominated bush lands is characterized by very poor vegetation cover with overgrazing causing the removal of topsoil and leading to intense red patches and silting of local water supplies. Rocky outcrops were observed to be quite common. Acacia tree species interspersed with perennial grasses dominated this habitat. Acaciageradii Benth was more dominant and closely associated with A. nilotica, and A. tortilis. Grasses predominant in this area included Digitariamacrobrephara Hack, Cynodon dactylon Pers., Themeda triandra Forsk, Cenchrus ciliaris L, Chlorisroxburghiana Schult. Setaria pyramidilis Beauv. and Pennisetum. Menzianum Leeke.10.
Highlands
The highlands are considered as high potential agricultural areas which are suitable for agriculture. However, a very small area is available for agricultural purposes due to steep slopes and shallow soils. A total of seven 7 forest fragments are found in this region, and characterized by continuous forest landscapes. Most forests (03°25'S, 38°22'E) are indigenous habitat situated at an altitude of 1,400 m measuring approximately 2 ha 22 and is regarded as part of remnants of the original montane forest, receiving 1700–2400 mm of annual precipitation. Tree species such as Lobelia gibberoa Hemsl, Phoenix sylvestris Sylvestris, Dracaena steudneri Engl. and Cyathea manniana L. are characteristic to this forest. Some isolated forests (03°28'S, 38°28'E) are mixed forest habitats comprising both indigenous and exotic tree species forming dense and continuous canopies, which has a reputation of being the most disturbed forest fragment out of most forest fragments. Tree species predominantly found in the highlands are cypress (Cupressus lusitanica), eucalyptus (Eucalyptus saligna), pines (Pinus caribea, P. patula), Maesopsis eminii and grevillea (Grevillearobusta) and Acacia mearnsii.
Sampling Procedure
In each study site (25 ha), twenty [20) linear transects of 250 m x 20 m each were established using a GPS to mark coordinates with relation to habitat type and altitude. Transects were used as a basic sampling unit for all bees and vegetation data. In addition, the central line transect method was used to represent different habitats of the entire study area and also increase the chances of sampling nesting sites and vegetation types that dominate all study sites.
In order to obtain quantitatively reliable data, each line transect (250m) was divided into five separate sections of 50m x 20m each. The starting point for bee sampling was rotated (starting from the first point and ending at fifth point, then beginning at point 5 during the next sampling round) between the end points of the transects to randomize sample collections thus reducing bias in data collection. Surveys were carried out along four successive different habitats (forest, grassland, bush lands and woodlands); the sites were chosen due to the dissimilarity in habitat structure with key factors such as isolation, geographic location and micro-climates taken into consideration.
Insect Pollinators Sampling Method
Meliponine bees were specifically sampled using the conventional complementary method, belt transect (direct observation of nesting colonies: visual census). Belt transect counts are the traditional (with standardized protocols) methods of sampling bees from existing vegetation 13.
The belt transect method was used to sample foraging bees within a transect of 250 m x 20 m at each site, a total of six (6) sites were sampled. While walking in each transect at a slow speed, nest colonies of meliponine bees were observed on both living and dead substrates. Each sampling day, observations were made from 8:00 hr to 5:00 hrs (9 hours) to encompass the main flowering periods (Figure 3) and peak foraging hours. Observations were made under conditions favorable for bee flights, characterized by sunny weather, weak wind and maximum temperature from 9: 00 hr to 5: 00 hrs.
Figure 3.Abundance per transect across major flowering seasons.
Statistical Analysis
Analysis of variance via R statistical package was used to compute the significant effect of habitat type on species abundance. A non-linear regression model such as the species accumulation curve was used to estimate the number of meliponine bee species represented in the whole surveyed area 20. The species accumulation curves was used to estimate species richness and rank abundance of meliponine bee species across varying habitats types 3. Biodiversity indices (species richness, abundance and Shannon index) were computed using the R statistical package called Biodiversity R 8. Species richness, species diversity (using Shannon index and Renyi diversity profiles), and the proportion of habitat type with most abundant meliponine bee species were computed using Renyi diversity profiles 19. Renyi diversity profiles are curves that provide information on richness and evenness, similar to rank abundance curves. Renyi diversity profiles however have the advantage over rank abundance curves because of easy rank ordering from lowest to highest diversity. For this reason, a Renyi diversity profiles was used in this instance 19.
Results
Meliponine Species Composition
A total of four (4) different meliponine bee species were identified on the basis of morphological differences in the field (Table 2). The four species were determined at species level based on the descriptions from literature of African meliponine bee species 4. All the four species were recorded in all the habitats sampled in the lowlands. (Table 2). Hypotrigona gribodoi was the most dominant species across the two study sites (58.3%) of all recorded nests, followed by Meliponula ferruginea (32.0%). The proportion of Plebeina hildebranti (7.4%) and Hypotrigona ruspolii (2.3%) species revealed that they were the least distributed species. This indicates that all the four (4) species were highly dispersed in distribution across the three habitats (Mixed deciduous woodlands, grasslands and Acacia dominated bush lands) in lowlands sites. The species showed a rank abundance of 1 for Hypotrigona gribodoi, (2) for Melipona ferruginea, (3) for Plebeina hildebrandti and (4) for Hypotrigona ruspolii respectively.
Table 2. Rank of total bee species observed within Taita hills.| Species | Rank | Total abundance | Proportion |
| Hypotrigona gribodoi | 1 | 102 | 58.3 |
| Meliponula ferruginea | 2 | 56 | 32.0 |
| Plebeina hildebrandti | 3 | 13 | 7.4 |
| Hypotrigona ruspolii | 4 | 4 | 2.3 |
Meliponine Species Nest Abundance
Data analysis was illustrated by box plots which showed varying distribution ranges of meliponine bee nest species within the four habitat types (forests, grasslands, woodlands and bush lands) (Figure 4). Species nest abundance was skewed to the left particularly in dispersed habitats of the lowlands characterized by mixed deciduous tree woodlands (MDW), Acacia dominated bush lands (ADBL) and grasslands (GL), signifying a normal distribution. The range of nest abundance was wide in habitats characterized by ADBL, GR and MDW. Site type (fragmented and unfragmented sites) had significant effect on nest abundance (P = 0.003) (Figure 5), thus revealing a distinct preference between the two main site types.
Figure 4.Range of Nest abundance within specific habitats. Note: IMF=Indigenous mist forest (H), ADBL=Acacia dominated bush lands (L), EFP=Exotic Forest Patches (H), GR=Grasslands (L), MDW=Mixed deciduous woodlands (L).
Figure 5a.Mean nests abundance in four habitat types. Note: IMF=Indigenous mist forest (H), ADBL=Acacia dominated bush lands (L), EFP=Exotic Forest Patches (H), GR=Grasslands (L), MDW=Mixed deciduous woodlands (L).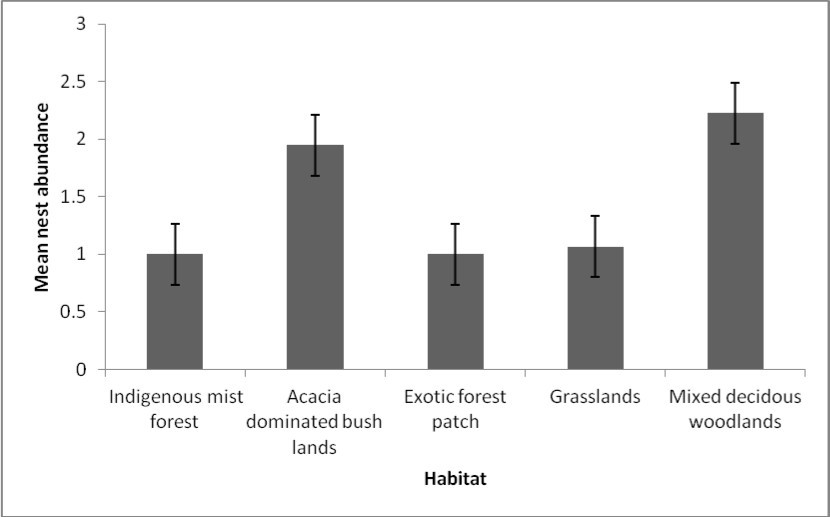
Figure 5b.Mean nests abundance across the two site types.
Meliponine Bee Species Richness and Diversity
According to the Renyi diversity profile, a total of four species was recorded across the four main habitat types sampled and further extrapolation with Shannon evenness index also predicted a total species richness of 4.24 (Table 3). The species accumulation curve reached a plateau with about four species at exactly 80 sampling points (Figure 6). A comparison of species richness for individual habitats showed no significant difference in species richness (p = 0.08). The profiles indicate that MDW habitat was more diverse than ADB, GL, EFP and IF habitats in descending order. The EFP and IMF could not be adequately ordered, as the profile curves overlapped. At the α = 0 scale, IMF habitat overlapped EFP habitat, at the α = 1 (Shannon index), species diversity was ranked in sequential order MDW>GL>ADB> EFP>IMF, at the α=2 (Simpson index) species diversity showed the same pattern for the three (3) dispersed habitats in the lowlands. Shannon diversity extrapolation for each habitat predicted more species in mixed deciduous woodlands and grasslands than for other habitats.
Table 3. Diversity indices for each habitat in the study site| Diversity index | ||||||
| Habitat | Sampled points | Total Richness | Shannon diversity | Total Abundance | Evenness | J Evenness |
| IMF | 2 | 1 | 0 | 2 | 1 | NaN |
| ADBL | 19 | 3 | 0.723 | 32 | 0.687 | 0.658 |
| EFP | 2 | 1 | 0 | 4 | 1 | NaN |
| GR | 31 | 3 | 0.965 | 41 | 0.875 | 0.879 |
| MDW | 44 | 4 | 1.010 | 96 | 0.686 | 0.728 |
Figure 6.Species accumulation curve for meliponine bee species.
Discussion
Meliponine Bee Species Composition.
Species number recorded in all sampled sites indicates the composition of meliponine bee species within this hotspot, though this is comparatively less than the species recorded in Kakamega, it unmistakably signifies the effects of habitat fragmentation in determining species composition within an ecosystem5. The majority of H. gribodoi species was more dominant and featured in all habitat types but at variable proportions, which may be attributed to its plasticity in nesting in varying habitat types.
Meliponine Bee Species Richness and Diversity.
The four species recorded directly from sampling are close to the J Evenness extrapolated predicted value of 4.24. The species accumulation curve indicated approximately 80 sampling points as adequate to recover at least four species.
Conclusion
The species accumulation curve clearly distinguished habitat types that share similarity in species diversity. The habitat types with IMF and EFP were in the same group, while MDW and GR formed a divergent group from ADBL, both indicating similarities and close proximity to each other for habitats (dispersed habitats in lowlands) in the same group. Similar trends were noted in box plots with respect to habitat type (Dispersed lowland habitats) showing higher variation than continuous forested landscapes of the highlands, implying greater heterogeneity in dispersed vegetation in lowlands and uniform homogeneity in continuous forested landscapes in highlands. The study has shown greater species diversity in certain habitats with more deciduous tree species that are indigenous to this habitat and could thereby predict the richness and diversity of meliponine bee species.
References
- 1.Adriaensen F, Githiru M, Mwang’ombe J, Matthysen E, Lens L. (2006) Restoration and increase of connectivity among fragmented forest patches in the taita hills, southeast kenya.Rep. Crit. Ecosyst. Partnersh. Fund Proj.1095347968: 1–149
- 2.Brooks T, Lens L, Barnes J, Barnes R, Kihuria J K et al. (1998) The conservation status of the forest birds of the taita hills, kenya.Bird Conserv. Int.8: 119–39
- 3.Colwell R K, Chang X M, Chang J. (2004) Interpolating, extrapolating, and comparing incidence-based species accumulation curves.Ecology. 85(10), 2717-27.
- 4.Eardley C D. (2004) Taxonomic revision of the african stingless bees ( apoidea apidae apinae meliponini).African Plant Prot.10(2):. 63-69.
- 5.Ewers R M, Didham R K. (2006) Confounding factors in the detection of species responses to habitat fragmentation. , Biol.Rev.Camb.Philos.Soc 81(1), 117-42.
- 6.Frankie G W, Thorp R W, Newstrom-Lloyd L E, Rizzardi M A, Barthell J F. (1998) Monitoring solitary bees in modified wildland habitats: implications for bee ecology and conservation. , Environ. Entomol 27(5), 1137-47.
- 7.Hargis C D, Bissonette J A, Turner D L. (1999) The influence of forest fragmentation and landscape pattern on american martens. , J.Appl.Ecol 36(1), 157-72.
- 9.Maeda E E, Clark B, Pellikka P, Siljander M, Vi P T. (2010) . Driving forces of land-use change in the taita hills , kenya.Int. J 2-5.
- 10.LMA Omoro, PKE Pellikka, Rogers P C. (2010) Tree species diversity, richness, and similarity between exotic and indigenous forests in the cloud forests of eastern arc mountains, taita hills. , kenya. J.For.Res 21(3), 255-64.
- 11.PKE Pellikka, BJF Clark, Sirviö T, Masalin K. (2005) Environmental change monitoring applying satellite and airborne remote sensing data in the taita hills , kenya.Area. 223-32.
- 12.Pfeifer M, Burgess N D, Swetnam R D, Platts P J, Willcock S et al. (2012) Protected areas: mixed success in conserving east africa’s evergreen forests.PLoS One. 7(6), 1-10.
- 13.Potts S G, Vulliamy B, Roberts S, Toole C O&apos, Dafni A. (2005) Role of nesting resources in organising diverse bee communities in a mediterranean landscape.Ecol. 30(1), 78-85.
- 14.Reitalu T, Purschke O, Johansson L J, Hall K, Sykes M T et al. (2012) Responses of grassland species richness to local and landscape factors depend on spatial scale and habitat specialization. , J.Veg.Sci 23(1), 41-51.
- 15.Ricketts T H, Regetz J, Steffan-Dewenter I, Cunningham S A, Kremen C. (2008) Landscape effects on crop pollination services: are there general patterns?. , Ecol. Lett 11(5), 499-515.
- 17.Sasidharan K R, Kunhikannan C. (2007) Role of bees as pollinators of tropical forest species and need for conserving their diversity.Adv. pollen spore Res. Vol. XXIV, 79-91.
- 18.Tepedino V J, Stanton N L. (1981) Diversity and competition in bee-plant communities on short-grass prairie.Oikos. 36(1), 35-44.
- 19.Tóthmérész B. (1995) Comparison of different methods for diversity ordering. , J.Veg.Sci 6(2), 283-90.
- 20.Ugland K I, Gray J S, Ellingsen K E. (2003) The species-accumulation curve and estimation of species richness.