
Das an Electric Current have an Acoustic Component?
Abstract
The quantum model of electric current suggested by Feynman has been enlarged by n difference-differential Hamiltonian equations describing the phonon dynamics in one dimensional crystallyne lattice. The process of interaction between the electron and phonon components in a crystalline lattice of a conductor has been described by 2n parametrically coupled difference-differential Hamiltonian equations. Computer analysis of the system of these coupled equations showed that their solutions represent a form of the quantum recurrence similar to the Fermi-Pasta-Ulam recurrence. The results of the research might reconsider the existing concept of electric current and will be possibly helpful in developing an acoustic «laser».
Author Contributions
Academic Editor: Loai Aljerf, Department of Life Sciences, Faculty of Dentistry, Damascus University, Syrian Arab Republic.
Checked for plagiarism: Yes
Review by: Single-blind
Copyright © 2019 A.A.Berezin, et al.
 This is an open-access article distributed under the terms of the Creative Commons Attribution License, which permits unrestricted use, distribution, and reproduction in any medium, provided the original author and source are credited.
Competing interests
The authors have declared that no competing interests exist.
Citation:
Introduction
According to the quantum concept suggested by Feynman 1 an electric current in one dimensional crystallyne lattice (Figure 1) can be represented by n Hamiltonian equasions:
Figure 1.Basic states of electrons interacting with clusters of phonons in one dimensional crystalline lattice
 …….. (1)
Where n -is the number of atoms in a crystallyne lattice,  - is the amplitude of probability that the electron is near the n th atom,
  - is the energy that would have had the electron if it could not propagate along the chain of atoms in a lattice,
  -is the constant, b – is the distance between the neighboring atoms, x -is the coordinate.
The system (1) has solutions corresponding to the states of a certain energy:
 (2)
(2)
Feynman has shown 1 that the system (1) has a solution in the following form:
 ………. (3)
If to consider the density probability  =
= the electron current
  can be given as 1
 (4)
(4)
On the other hand the crystalline lattice is filled with a gas of phonons whose energy distribution along the chain of atoms can be also represented by the system (1) and the phonon current can be written like follows:
 (5)
(5)
Where  =
= is the density probability for phonons
So for a full description of an electric current it is necessary to take into account a process of interaction between electrons and phonons (it is not only scattering but a resonant interaction as well). Such interaction has to result in appearance of a product  . In other words to describe the dynamics of the electron and phonon amplitudes
  and
and  interaction process one has to reduce the equations similar to (1) to describe the phonon dynamics in one dimensional crystalline lattice and then to couple the electron and phonon equations.
By analogy with the system (1) the dynamics of the phonon energy disribution along the chain of atoms in one dimensional crystalline lattice (Figure 1) can be described as follows:
 (6)
(6)
Where n - is the number of the atom in a crystalline lattice, - is the amplitude of probability that the cluster of phonons is near the n th atom,
  - is the energy that would have had the cluster of phonons if it could not propagate along the chain of atoms in a lattice,
  -is the constant, b – is the distance between the neighboring atoms, x is the coordinate. The phonon current is known in a form of standing waves generated by Tesla transformers 2
A computer study of the systems of equations (1) and (6) shows two different types of their solutions depending on the boundary conditions that correspond to the fixed ends of the chain or open ones. In particular, for the open ends the solutions of (1) and (6) look strongly non linear at the beginning and at the end of the chain while they don't change considerably along all n points. Figure 2, Figure 3, Figure 4, Figure 5, Figure 6, Figure 7 show amlitudes of 
 and their Fourier spectra in the beginning, in the middle and in the end of the chain correspondingly. In case of the fixed ends the solutions of (1) and (6) look different. The relative linearty of
  is preserved during all the points of the chain while the amplitude magnitudes change by an order along the chain. Figure 8, Figure 9, Figure 10, Figure 11, Figure 12, Figure 13 show amlitudes of
  and their Fourier spectra in the beginning, in the middle and in the end of the chain.
Figure 2.Dynamic of the Real part of the amplitude Cph2 in (6) with fixed ends during the calculation. Horiz. Axis x,t;Vertical axis amplitude.Units conditional
Figure 3.Fourier spectrum of the Real part of the amplitude in Figure2. Horiz. Cph2 Axis-frequency; Vertical axis-amplitude. Units. conditional.
Figure 4.Dynamic of the Real part of the amplitude Cph24 in (6) with fixed ends during the calculation. Horiz. Axis x,t; Vertical axis amplitude. Units conditional.
Figure 5.Fourier spectrum of the Real part of the amplitude Cph24 in Figure 4. Horiz. Axis-frequency; Vertical axis-amplitude. Units.conditional
Figure 6.Dynamic of the Real part of the amplitude Cph50 in (6) with fixed ends during the calculation. Horiz. Axis x,t;Vertical axis amplitude.Units conditional
Figure 7.Fourier spectrum of the Real part of the amplitude Cph50 in Figure 6. Horiz. Axis-frequency; Vertical axis-amplitude. Units.conditional.
Figure 8.Dynamic of the Real part of the amplitude Cel in (1) with open ends during the calculation. Horiz. Axis x,t;Vertical axis amplitude.Units conditional.
Figure 9.Fourier spectrum of the Real part of the amplitude Cel in Fig.8. Horiz. Axis-frequency; Vertical axis-amplitude. Units. conditional.
Figure 10.Dynamic of the Real part of the amplitude Ce25 in (1) with open ends during the calculation. Horiz. Axis x,t; Vertical axis amplitude. Units conditional.
Figure 11.Fourier spectrum of the Real part of the amplitude Ce25 in Figure 10. Horiz. Axis-frequency; Vertical axis-amplitude. Units. conditional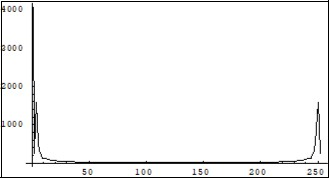
Figure 12.Dynamic of the Real part of the amplitude Ce50 in (1) with open ends during the calculation. Horiz. Axis x,t; Vertical axis amplitude. Units conditional
Figure 13.Fourier spectrum of the Real part of the amplitude Ce50 in Figure 12. Horiz. Axis-frequency; Vertical axis-amplitude. Units. conditional
Electron-Phonon Model of Electric Current in a Crystallyne Lattice
The system describing an interaction between electrons and clusters of phonons in a crystalline lattice can be given as a result of parametric coupling of (1) and (6):

………… (7)

Where  is the n th coupling coefficient along the chain <1, F1is the energy of the heat vibrations of the lattice.
The system (7) describes the interaction process between electrons and clusters of phonons in the crystalline lattice. The solutions of (7) represent a sophisticated energy distribution along the lattice. Since the system (7) represents in fact one of the quantum recurrence forms 3 the general solution of (7) will look like follows:
 ……… (8)

The first members in (8) represent the Fourier sequences and the second members - sums of nonequidistant harmonics formed as a result of dispersion in a lattice 3. Phases  reflect the individual parameters of the crystalline lattice (admixtures, plastic deformations, vacancies, dislocations, anisotropy etc). Within the framework of the proposed electric current model solutions (8) any electrical or ionic current can carry information about the properties of the crystalline lattice or plasma, or ionic solution where the current flows. In connection with this it's worth mentioning about an original experiment carried out by an australian researcher Bevan.L.Reid 4 in which he showed that an ionic current passing between the two vessels with sodium chloride solutions proved to be able to carry information for the crystal growth patterns from one vessel to another.
Computer study of the system (7) solutions shows an intermittency process typical for the recurrence mode similar to the Fermi-Pasta-Ulam recurrence 5. As it has been shown 5 that the recurrence phenomenon possesses a «memory» for the initial conditions and redisplays their configuration during the period of recurrence.
The coupled system (7) can simulate a physical functioning of a simple electric transformer for example an ingnition coil. As a first step of applying the computer model for a desciption of this electrical device the system's boundary conditions were chosen to simulate two coils of an electric transformer for example, an ingnition coil. For that purpose the boundary conditions of the first (electron) equation of (7) corresponded to the open ends of the chain and for the second (phonon) equation for half fixed ends (the beginning of the chain had fixed ends but the end had open ones). The solutions in this case show that despite an equal number of points in both difference-differential equations in (7) the amplitude in the electron chain was by an order larger than that in the phonon chain. It allows to speak out in favor of a quantum mechanical basis for the describing the physics of a simple electric transformer. The transformer mode of the system (7) is shown in Figure 14, Figure 15, Figure 16, Figure 17.
Figure 14.Dynamics of the Real part of the amplitude Cph1 in the system (7) simulating the transformer mode. Horiz. Axis x,t; Vertical axis amplitude. Units conditional
Figure 15.Dynamics of the Real part of the amplitude Ce2 in the system (7) simulating the transformer mode. Horiz. Axis x,t; Vertical axis amplitude. Units conditional.
Figure 16.Dynamics of the Real part of the amplitude Ce10 in the system (7) simulating the transformer mode. Horiz. Axis x,t; Vertical axis amplitude. Units conditional
Figure 17.Dynamics of the Real part of the amplitude Cph1 0 in the system (7) simulating the transformer mode. Horiz. Axis x,t; Vertical axis amplitude. Units conditional
The results of the transformer mode simulation within the proposed model suggest a quantum mechanical basis for the description of its physical functioning. That is an exchange of energy between the two electron and phonon quantum recurrences (8) in accordance with the general properties of the resonant interaction between the recurrences 6. According to the model the most essential parameter is the rate of interaction between the recurrences along the whole chain (coefficients  in (7)) which can be changed by inserting into the system an another crystalline lattice of a core whose parameters differ from the lattice that under consideration in the model. In fact, it adds another couple of equations like (7) into the model. Using different material for the core can result in regrouping of the energy in the electric current between electron and phonon components. For example such material as ferrite possessing with ferroelectric properties and a high electric resistance can cause an increasing the energy of the phonon part of the electric current in a transformer, whereas such conductive ferromagnetics as iron, steel and their alloys can be effective for icreasing the electron part of the energy especially at low frequencies.
Next step of the computer simulation was to visualize the general dynamics of the interaction between electron and phonon amplitudes described by the equations (7) in case of the open ends mode of the boundary conditions for both chains in (7).
Computer solutions of the electric current model (7) given in Figure 18, Figure 19, Figure 20, Figure 21 manifest a periodical repumping of the electron and phonon energy in a crystalline lattice between sums of equidistant and nonequidistant harmonics (8). For a model (7) with a large number of «atoms» (n=1000) there were observed much longer orders of spatial periodicity in solutions and their periods were multiple to the lattice parameter b. According to the model an electric current in a crystalline lattice of a conductor can appear as a result of increasing energy of the phonon component in (8) due to starting of the intrinsic selfparametric processes. The crucial parameter that brings the system (7) into a selfparametric excitation mode proved to be the the values of the coupling coefficients  reflecting the rate of interaction between electron and phonon amplitudes along the chain. This mode demonstrates an exponential encreasing of the amplitudes (7) with time and space. A physical interpretation of it is a sharp increasing of the heat vibrations in the lattice. Figure 22, Figure 23 show the selfparametric mode in the system (7) when
  .Worth mentioning that the selfparametric excitation mode can arise in a closed dynamic system and the energy for increasing oscillations is extracted from the system itself. This phenomenon is well known in radioelectronics as a consequence of the Mathieu equation's physical realisation in a form of parametric electric generators having specific properties 7. In particular an exponential growth of the generator's current could be restricted only by switching non linear resistors for example filament lamps into the generator's ciruit.
Figure 18.Fourier spectrum of the Real part of the amplitude Cen dynamis in the system (7) with open ends during the calculation. Horiz. Axis-frequency; Vertical axis-amplitude. Units. conditional
Figure 19.Fourier spectrum of the Real part of the amplitude Cen+1 dynamics in the system (7) with open ends during the calculation. Horiz. Axis-frequency; Vertical axis-amplitude. Units. conditional
Figure 20.Fourier spectrum of the Real part of the amplitude Cphn+1 dynamics in the system (7) with open ends during the calculation. Horiz. Axis-frequency; Vertical axis-amplitude. Units. conditional
Figure 21.Fourier spectrum of the Real part of the amplitude Cphn dynamics in the system (7) with open ends during the calculation. Horiz. Axis-frequency; Vertical axis-amplitude. Units. conditional
Figure 22.Self parametric excitation mode in the system (7 ) when αn=0.03 .Vertical axis- Real part of the amplitude Cen, horiz axis –number of calculation steps
Figure 23.Self parametric excitation mode in the system (7 ) when αn=0.03. Vertical axis- Real part of the amplitude Cphn, horiz axis –number of calculation steps.
The solutions of the system (7) (Figure 22, Figure 23) suggest an another property of the electric current: to concentrate energy of electrons and phonons in the part of a crystalline lattice that has different parameters to compare with the main part of it and that result in changing the values of the interaction coefficients  . For example combining two types of a conducting wire: a copper and a tungsten one will lead to a considerable heating in the tungsten part to compare with the copper one because the other type of the tungsten's cystalline lattice causes a development of the selfparametric mode in its part for the electron and phonon components (Figure 22, Figure 23) of the current.
Conclusion
Enlarging of the quantum model of electric current suggested by R.Feynman resulted in widening of the general concept of electric current and hammering out the electron-phonon interaction mathematical model of electrical current . Proposed model shows another essential property of electric current - the presence of the phonon component in the conductor's crystalline lattice possessing a considerable amount of energy. According to the suggested model any electric current represents a quantum recurrence between the energies of electron and phonon components. That brings a new possible usage of the conductor's crystalline lattice energy as a huge reserve for saving electrical energy since all transmission lines materials represent crystalline lattice phonon energy containers. Beside that, a new concept of the electrical current reveals the ways for some possible modifications of such electrical devices as transformers, motors, heaters etc to enhance their efficiency. The results of the suggested model computer study display reasons for possible happening of large scale blackouts in electrical networks as a result of formation of a long distance spatial selfparametric excitation expressed in increasing of the amplitude voltage oscillations damaging the network devices. To crown it all the selfparametric excitation mode found during the study of the model puts forward a concept for developing of a phonon laser.
References
- 3.Berezin A A. (2003) Quantum recurrence and its possible application.Oral presentation. English text is available.
- 4.Bevan L Reid. (1987) The Ability of an Electric Current to Carry Information for. , Crystal Growth Patterns.Journal of Biological Physics, V 15, 33-35.