
Confirming Tonality at Residences Influenced by Wind Turbines
Abstract
For 5 years, since the start-up of an array of 140 wind turbines, residents have filed complaints with the Ontario Ministry of the Environment (the regulator), and K2 Wind (the operator). Residents complained that the turbines produce a tonal sound, and that the irritation this produced impacted their sleep, their health, and the enjoyment of their property. To confirm tonality from the wind turbines, this research examined over 200 data examples from two families. These families collected data by two independent methods, a continuously recording system, and by making selected audio recordings. The recorded data was correlated with the wind turbine operational performance, and local weather conditions. The correlated data was analyzed for tonality using international standard evaluation methods. The analysis confirmed over 84% correlation between complaints of irritating conditions, and tonality from 5 dB to over 20 dB. Finally, the results showed that the assumption of the regulator to only require assessment of compliance when the resident was downwind of the nearest wind turbine was incorrect. Most complaints arose from other wind directions. Neither was the regulator’s assumption correct that curtailing the wind turbine operation to continue operating at only partially reduced outputs would give remediation. The research concludes that tonality arises consistent with the wind turbine operation, identifying a critical need to revise the practices to prevent chronic irritation. In the original issuance of this paper, the author inadvertently erred by stating that there was a difference between the method for assessing wind turbine tonality of an expert group panel and the method now prescribed by regulations. That statement was incorrect, and the author apologizes for the error and for any confusion it may have caused. The error, miscalculations resulting from the error, where necessary conclusions drawn from erroneous calculations are corrected.
Author Contributions
Academic Editor: Loai Aljerf, Department of Basic Sciences, Faculty of Dental Medicine, Damascus University, Damascus, Syria.
Checked for plagiarism: Yes
Review by: Single-blind
Copyright © 2019 William K.G. Palmer
 This is an open-access article distributed under the terms of the Creative Commons Attribution License, which permits unrestricted use, distribution, and reproduction in any medium, provided the original author and source are credited.
Competing interests
The authors have declared that no competing interests exist.
Citation:
Introduction
Coincident with the 2015 start-up of a wind power development 1 consisting of 140 wind turbines, with the associated electrical power lines, and transformer stations to produce electrical power in Ontario, Canada, citizens identified concerns with irritation from tonality heard that impacted sleep, and caused “loss of enjoyment of normal use of their property” (as defined by the provincial Environmental Protection Act) 2 during waking hours as well. This research focused on two of these residences.
Two assessments by the Ontario Ministry of the Environment (the regulator) in June 2016 and in March 2017 at both of the residences when the residents were permitted to trigger a series of recordings during times of irritation concluded that “there is a possibility that sound from the nearby turbines could be tonal.” Assessment of the sound files collected by the ministry from their instrumentation confirmed the presence of tones recorded on the ministry equipment at about 435 Hz, approximately 12 dB higher than the sound at frequencies just above or below the tone. The recordings were correlated to the electrical output of the wind turbine array showing the wind turbine array was operating in curtailed conditions, when the output was less than the capability.
After the regulator’s assessment with their instrumentation, residents at one home purchased and installed a research grade acoustic monitoring system 3, the Soundscape Analysis and Measurement (SAM) Scribe capable of continuously recording two channels. Calibrated microphones 4 were installed with primary 90 mm and secondary 450 mm windscreens outside the home. Residents at the second home contracted with an acoustic consultant to make acoustic environment recordings, and then initiated a program of making acoustic recordings of the soundscape on an iPhone using an external calibrated measurement microphone 5 at times they considered to be most irritating. Both residents made their recordings available for evaluation.
Residents at both homes provided listings of the times they filed complaints with the Ministry of the Environment in 2016, and later. Correlation of the complaint data with the weather conditions 6 existing at the time of the complaint and the turbine electrical output 7 at the same time showed that the majority of complaints occurred when the residents were other than downwind ±45° of the nearest wind turbine, and at turbine output power levels below 85%. The Ontario wind turbine compliance protocol 8 only considers power levels above 85% when residents are downwind ± 45° of the nearest wind turbine (the turbine with the greatest predicted noise impact) as the times complaints would be evaluated.
In 2018-2019 an acoustic audit was performed for the regulator at each residence. Residents identified specific times that the conditions were most irritating. The intent of this paper is to provide an evaluation of the tonality conditions occurring at times identified by the residents during the acoustic audit. Rigorous compliance with international standards and reference to recent peer reviewed literature on tonality, is included to assist regulators in assessing the conditions that impact the citizens, and to provide a basis for revision of compliance protocols. The hypothesis tested was that tonality caused by the wind turbines as identified in international standards exists as a chronic condition, causing irritation impacting health, and reducing enjoyment of normal use of property.
Experimental Procedure
1) Assessment was made of the data collected by the regulator during initial acoustical assessments to determine indications of tonality they showed.
2) Tests were conducted to determine the optimum locations of microphones at the first residence to permit monitoring data by the two channel continuously recording system to ensure the data collected would represent free field conditions. The objective was to select monitoring sites that would permit recording data during all environmental conditions. Free field locations suffer from the problem that rainfall or snow pellets striking the windscreen can influence the recordings. It was necessary to show that sheltered sites would provide unimpeded acoustic access to the source of the sound, without introducing artifacts.
3) Environmental weather and turbine array hourly output and capability conditions were evaluated for the times when complaints were filed by the residents:
a) From November 16, 2018 to April 30, 2019 at one residence.
b) From March 10, 2019 to April 10, 2019 at the second residence.
c) Wind speed, wind direction, and other environmental conditions were taken from the Environment Canada weather monitoring station at the Goderich airport 6. The wind turbines in the environment of the residents are visible from the Environment Canada monitoring station, located about 10 km from the residences on a flat agricultural landscape.
d) The wind turbine hourly output and turbine array forecast output, is available from the Ontario Independent Electricity System Operator. (IESO) 7.
4) An initial evaluation of the tonality for each of the complaints was performed using Tone-to-Noise Ratio (TNR) as identified in Annex A to American National Standard – Measurement of Sound Pressure Levels in Air, ANSI S1.13-2005 9.
a) This method identifies a tone will be just audible when the sound pressure level of the tone is about 4 dB below the sound pressure level of the masking noise contained in the critical band centered around the tone. A tone will be identified as prominent if the sound power level of the tone is greater than the sound pressure level of the masking noise as determined by this equation: (from ANSI S1.13-2005 Annex A Equation A.10B, for ft < 1,000Hz).

b) For a tone frequency of 450 Hz, this corresponds to a value of 10.9 dB above the masking noise level in the critical band, or about 14.9 dB above the just audible level. Published work by Francis, Lee, and Wang 10 shows that this method can be used to determine a tone as “prominent,” but did not determine the human thresholds of annoyance for tones in noise.
5) A detailed evaluation was then carried out for 12 cases to determine tonality and Tonal Audibility [∆Lta] as introduced in International Organization for Standardization (ISO) 1996-2 Annex C (ISO, 2007) 11 to show the Tone-to-Noise Ratio method used would permit an assessment of the Tonal Audibility. Detailed discussions of the Tonal Audibility method can be found in the report prepared for the International Energy Agency by the Expert Study Group on Recommended Practices for Wind Turbine Testing and Evaluation 12 and in International Standard 61400-11 Ed 3.0 (2012), Wind turbines – Part 11: Acoustic noise measurement techniques. 13
Materials and Methods
1) Wind speed, wind direction, barometric pressure, temperature, dew point, and other environmental conditions relative to this study site are available on an hourly basis since December 1994 from the website of the Environment Canada weather station at the Goderich Airport. 6 The data was assembled for the entire period of the research, since the wind turbine array commenced operation. The data was correlated with complaints filed by the residents.
2) The K2 wind turbine actual output and forecast output (the capability of the wind turbines if not curtailed by system direction) were available since the wind turbine array commenced operation from the Ontario Independent Electricity System Operator (IESO) website Generators Output and Capability Report via daily and annual reports. 7 This data was also correlated with the complaints filed by the residents.
3) Continuous recording of the acoustic conditions at the first residence were available for the period of the acoustic audit conducted in the acoustic audit conducted in 2018-2019 for the regulator using the Soundscape Analysis and Measurement (SAM) Scribe 3. The Primo EM246 Microphone Capsules 4 used with the SAM Scribe have electret condenser transducers with a sensitivity that is constant to within ±1 dB for the frequency range from 0.5 Hz to 5 kHz, although the system uses a 1 Hz high pass filter to remove very low frequencies. One microphone was mounted outside the home with a 90-mm primary wind screen and a 450-mm secondary windscreen. The second microphone was mounted on a flat, 1-metre diameter board, with a 90-mm primary windscreen and a 450-mm semi-spherical secondary windscreen attached vertically on the exterior wall of the home. The microphone locations were chosen to permit monitoring during all weather conditions. Testing was conducted to compare the readings of the sheltered locations with free field locations to ensure the sheltered locations did not introduce error. Calibration checks of each microphone were recorded using a 94 dB 1000 Hz calibrator before, and after the measurement campaign, and after any change in configuration. (Temporary removal of the windscreens for changes of desiccant, or replacement of failed cables, as examples). This acoustic condition record was correlated with the complaints filed by the residents.
4) The recordings of selected irritating acoustic conditions at the second residence were made by making video recordings using an external MOVO MA2000 measurement microphone 5 protected by a synthetic fur windscreen, connected to the lightning jack of an iPhone 7 Plus. The MA 2000 microphone has an electret condenser transducer, with a flat response ±3 dB from 35 Hz to 18,000 Hz. Generally, the sound samples collected by this microphone were from an open window of the residence pointing towards the nearest turbine sheltered from direct wind or rain impingement, while other sound samples (as identified) were collected inside the residence pointing into a room to be able to identify the conditions present inside the room. Again, calibration recordings were made using a 94 dB 1000 Hz calibrator. The .mov video records from the iPhone were converted to an audio .wav format using the web based application, “online-convert.com” 14 at a 32-bit resolution using a 44,100 Hz sampling rate to produce monaural sound files for narrow band analysis.
5) Analysis of the .wav files stored by the SAM Scribe or from the converted iPhone recordings were conducted using the MacOS application by Faber Acoustics 15, Electroacoustics Toolbox, Version 3.9.9. The Electroacoustics Toolbox application provides the ability to calibrate the system for each microphone calibration recording, so that can be used to produce calibrated outputs from the microphone. The application was used to perform FFT analysis at frequency window widths of 0.5 Hz, 1 Hz, 2 Hz, and 5 Hz. It was also used to generate a calibrated Sound Level Meter output for an A-Weighted, C-Weighted and Z-weighted (Flat) filter, as well as one-third octave analysis at the same filter weighting for each sound sample.
6) An initial graphical evaluation was performed for each case to determine tonality from Tone-to-Noise by comparing the sound pressure level at the tonality peak as determined by the FFT analysis of the sound sample in the frequency range being studied (400 Hz. ± 100 Hz.) to an averaged sound pressure level just above and just below the critical bandwidth for the local tonality peak.
7) A detailed evaluation was performed to determine the tonality and tonal audibility for each sound sample using a Microsoft Excel spreadsheet developed from the critical bandwidth and the effective noise power bandwidth for each sample to allow calculation of the tonality and tonal audibility for each assessment. The spreadsheet is available from the author.
Results
A summary of the main results for each of the 5 sub-sections outlined in the Experimental Procedure is given in Table 1.
Table 1. Summary of Main Results| Test Section | Summary of Main Results | |
| Evaluation of Initial Regulatory Test Results | Evaluation of regulator’s data from June 2016 test showed tonality > 12 dB, occurring during time of turbine curtailing and normal operation. | Evaluation of regulator’s data from March 2017 test showed tonality > 12 dB continued to occur. Regulator concluded “possible tonality” calling for detailed audit. |
| Determine Optimum Microphone Location | First test showed locating microphone in sheltered location on open air covered porch was indicative of tonality received at free space microphone and permitted continuous operation in inclement weather conditions. | Second test confirmed microphone in sheltered location on open air covered porch gave better results with less artifact noise than partially protecting free space microphone. Residence gable end microphone location was sheltered from rain and snow, with direct line of sight to nearest microphones north and south of residence. |
| Evaluate Weather and Turbine Output at time of Complaints | Wind rose for residence one complaint filing period showed most complaints arose from directions regulatory protocol prohibits for use. Fewest complaints occurred from direction of closest turbine which regulations specify to use, as least wind came from that direction. | Wind rose for residence two showed wind speed and frequency of occurrence is lowest from direction regulatory protocol requires to use. |
| Simplified Graphical Evaluation of Tonality | 84% of conditions identified by residents as tonal were shown to be tonal. Differences occurred due to wind impinging directly on microphone, or other sources of raised background. | Reanalysis by detailed calculations in accordance with IEA recommendations for masking noise bandwidth showed graphical evaluations conservatively predicted less tonality than the detailed calculations. |
| Tonal Audibility Evaluation | Tonal Audibility evaluated as prescribed by IEC 61400-11 Ed 3.1 shows only 3 of 12 of the analyzed spectra to be audible. | A listening test of each audio file presents an audible signature. Graphical evaluation shows a peak value > 10 dB higher than on either side of the “critical bandwidth” for 11 of the 12 files. |
Results Sub-Section Part 1 – Evaluation of Initial Regulatory Test Results
This sub-section performed an initial Tone-to-Noise evaluation of tonality existing in the samples taken by the regulator using their instrumentation in two tests, in June 2016, and in March 2017. These evaluations are described as sent to the regulator after conducting the evaluations.
Analysis of sound samples collected during the first assessment (the regulatory Category C assessment) made in June 2016 by the regulator using their instrumentation showed indications of tonality as shown in Figure 1 occurring at times the wind turbine output was “curtailed” (operating at less than capable output due to electrical system lack of need.) Figure 1 shows the uncalibrated output of an Audacity spectrum analysis for two ministry recordings, and one recording made by the residents using a hand-held tablet which has an earlier low frequency roll-off. The sound reading times are correlated to the wind turbine array electrical output obtained from the Sygration (Rodan Energy Solutions) website 16 based on data provided by the Ontario Independent Electricity System Operator. All three Audacity spectrum analyses use the Hanning function and a spectrum size of 65536 lines for a sample width of 0.7 Hz. The uncalibrated data provides the ability to determine the Tone-to-Noise Ratio for each recording at about 12 dB.
Figure 1.Analysis of June 2016 Sound Sample Collected by Regulator during Category C Test 
Analysis of the sound samples collected by the regulator during a second Category C test made in March 2017 again confirmed the presence of tonality as shown in Figure 2. The regulator reports concluded, “Based on the results of the analysis, the sounds from the wind turbines were audible (and audible tones) at levels that appear to exceed the applicable sound levels. ... To confirm compliance, it is recommended that a tonal audibility assessment and detailed noise audit be undertaken in accordance with Part D of the draft Compliance Protocol for Wind Turbine Noise, NPC 350, 2017.”8
Figure 2.Analysis of March 2017 Sound Sample Collected by Regulator during Category C Test
Results Sub-Section Part 2 – Determine Optimum Microphone Location at First Residence
This sub-section describes results from the experimental procedure to determine the optimum position for microphones to permit continuous recording of sound conditions.
Analysis of the initial data collection from the SAM Scribe identified a concern in obtaining data during all weather conditions. The resident was required to cover, or bring the microphones indoors prior to rain to protect the microphones, and as a result data was not available for some time periods. A test was conducted at a third home in Niagara Region, using two SAM Scribe systems at the same time, to compare data collected from a free field microphone (located on an open lawn more than 5 metres from the nearest reflecting surface) with that collected from a partially sheltered microphone located about 1.1 metre from the outdoor wall of the residence on an outdoor covered porch/deck (an open to the air platform connected to the residence at the ground floor elevation of the residence, covered by a roof as shown in Figure 3). Tests were conducted for microphones mounted 1.5 metres above the surface (Figure 4), with a 90-mm primary and a 450-mm secondary windscreen, and for ground board mounted microphones (Figure 5) with a 90-mm primary and a 450-mm secondary windscreen. The tests showed that there was good correlation between the data from the free-field microphones, and the microphones on the covered porch.
Figure 3.Microphone Locations on Porch/Deck for Comparison to Free-Field Microphones on Lawn
Figure 4.Comparing Vertical Microphone output in Free-Field and on Covered Porch/Deck
Figure 5.Comparing Ground Board Microphone in Free-Field and on Covered Porch/Deck
2) It was possible to observe from the tests:
a) Microphones mounted on a covered porch/deck outside the home, accurately represented the free-field conditions on the lawn at a distance greater than 5 metres from the home. The porch/deck-mounted microphones were generally lower by 1 dB or so in output than the lawn mounted microphones, but they showed a similar frequency spectrum, and gave accurate determination of tonality and the special quality of the wind turbine sound.
b) The slightly lower reading of the porch/deck-mounted microphones was of less significance to this study compared to the advantage of being able to leave the microphones in service in all weather conditions. Annoyance and irritability is influenced by both the special characteristics of tonality and cyclical nature as well as by a threshold value of 40 dBA, and the intent of this assessment is to focus on tonality.
c) Increase in turbine power showed a significant increase (> 10 dB) in sound pressure level at the residence, even though the wind direction was orthogonal (at right angles) to the direction of the nearest turbine, not downwind.
d) Sound pressure level readings at the home were over 50 dBA when the turbine array was at moderate or high power. The sound pressure level decreased as turbine output decreased, and increased as the turbine output increased.
e) Microphones located on the porch/deck of the home were more impacted by increase in low frequency level as the turbines increased in output than microphones on the lawn, showing that guidelines to monitor sound only outdoors distant from homes is not representative of the increase in irritation near or in the home caused by increase in low frequency sound as turbine output rises.
3) A further test was conducted at the first residence in this study to compare results obtained in the free-field (on lawn) at a distance greater than 5 metres from the home with the results of a microphone mounted on a covered porch about 1.1 metre away from the outside wall of the residence. Both microphones are visible in Figure 6.
Figure 6.Microphone Test Locations for Free-Field and Covered Porch
(Figure 7) shows that while the sound pressure levels at the residence drops by 10 to 20 dBC when the forecast MW and output MW of the wind turbine generators drops, if only the output MW drops while the forecast MW does not (indicating the turbine generators were operating in a curtailed fashion) the sound pressure level is not appreciably reduced.
Figure 7.Correlating Microphone Output to Wind Turbine Output and Forecast
5) Outputs from the Electroacoustics Toolbox program 15 show the frequency spectrum, sound level meter, and one-third octave analysis for the SAM Scribe microphones 3 mounted in the free-field (lawn – blue microphone) in Figure 8, and on the porch (red-microphone) for the same time in Figure 9. Comparison of the two figures shows that while both show a similar magnitude of tonal peak in the FFT output charts, the free field microphone showed a somewhat higher dBZ sound level meter output at 77.7 dBZ than the covered porch Microphone at 72.4 dBZ. In contrast, the free field has a somewhat lower dBA sound level meter output at 34.9 dBA, compared to the covered porch microphone at 41.4 dBA.
Figure 8.Blue (Free Field) Microphone on 2018-11-16 at 07-50 hours
Figure 9.Red (Covered Porch) Microphone on 2018-11-16 at 07-50 hours.
6) The detailed evaluation in Figure 10 of the frequency spectrum shows that both the Free-Field (Blue) and the Porch (Red) Microphones displayed a similar tonality profile, and a tonality magnitude of 9.4 dB at 450 Hz.
Figure 10.Tonality Spectrum of Red (Left = Covered Porch) and Blue (Right = Free-Field)
7) It was possible to observe from the test:
a) A tertiary weather protection of the free-field microphone by wrapping the top two-thirds of the windscreen with a water repellant film resulted in some desensitization of the free-field microphone, so that the free-field microphone read about 1 dBC lower than the porch microphone which did not require tertiary weather protection.
b) Sound levels at the residence correlated to the forecast turbine output, and tonality could be observed even when the turbines were curtailed when output was lower than the forecast.
c) Both microphones recorded the same tonality profile and tonality.
8) Because of the impact of the weather protection of the free-field microphone sensitivity, the microphone locations chosen for the remainder of the audit monitoring were on the east gable end of the residence as shown on Figure 11 and on the south covered porch of the residence as shown on Figure 12. In these locations, the microphones were protected from direct impingement of rain by the house roof overhang, and did not need secondary weather protection. It also ensured that the gable end microphone (which was used as the primary source of recording data) would not be directly in the predominant westerly winds, and would have a direct line of sight with the wind turbines which are located north and south of the residence 17 as shown on Figure 13.
Figure 11.Location of Gable End Microphone 
Figure 12.Location of Covered Porch Microphone
Results Sub-Section Part 3 – Evaluation of Weather and Turbine Output at Times of Complaints
This sub-section gives the results for an evaluation of the environmental weather conditions, and the wind turbine outputs occurring at the times resident complaints were filed.
At First Residence
The category D tonality audit for the regulator at the first residence occurred between noon December 18, 2018 and noon April 30, 2019 (a 3192-hour window). The Goderich weather data 6 was used to prepare a wind rose (see Figure 14) based on the bearing of the closest wind turbine 17 (T208 in Figure 13) for the period when the audit at the first residence was performed.
Figure 13.Wind Turbine Location by Sector for Residence One
Figure 14.Wind Rose for First Residence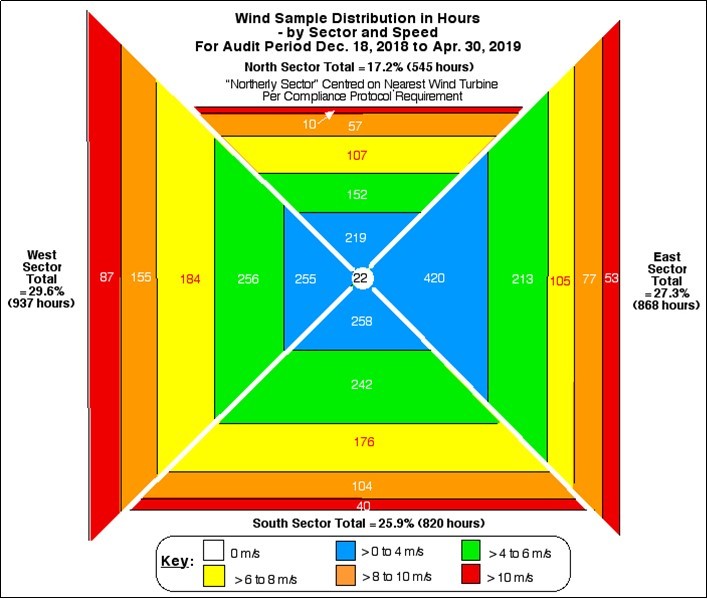
2) Correlating the wind rose from Figure 14, and the wind turbines nearest the first residence from Figure 13, the following observations are possible when considering the complaints filed from Residence 1:
a) The wind rose demonstrates that the “Northerly Sector” centered on the nearest wind turbine (T208) had the smallest number of hours at 545 (17.2% of the total) of any sector.
b) While the “Westerly Sector” had the largest number of wind hours at 937 (29.6% of the total), and significantly more high wind hours (426 hours > 6 m/s) than other sectors, the nearest wind turbines in this sector are at distances greater than 3 km.
c) The “Easterly Sector” had the second highest number of total hours at 863 (27.3% of the total), but with a larger proportion at lower wind speeds than other sectors (633 hours under 6 m/s). The easterly sector has no wind turbines at all. The criterion of the Ontario “Compliance Protocol for Wind Turbine Noise” is to monitor only the conditions for winds within ±45° of the turbine with the greatest predicted noise impact (T208 on which the “Northerly Sector” is centered) would suggest that there would be little or no noise impact when the wind is from the “Westerly Sector” with no turbines within 3 km; or from the “Easterly Sector” with no turbines at all and the majority of winds at low speeds; yet between them, the Westerly and Easterly Sectors generated 74 of the 111 records for irritating noise (67%).
d) The “Southerly Sector” opposite the nearest turbine, had the second lowest number of total hours at 820, but the second highest number of hours with wind velocity greater than 6 m/s. While the compliance protocol for wind turbines would suggest this sector would not be responsible for complaints, it generated the second highest number of complaints.
At Second Residence
The second resident family performed over 100 sound recordings during the Category D audit conducted for the regulator. The recordings were performed using the method described previously with an external calibrated measurement microphone and an iPhone 7 Plus. This residence has 3 turbines within 1 kilometre (1 km.), 8 more within the range from 1 km. to 2 km., and 7 more turbines within the range from 2 km. to 3 km 17. The audit for the regulator was performed between noon Jan. 11, 2019 and noon Mar. 20, 2019. The Environment Canada data from the Goderich Airport 6 located less than 10 km from the residence was used for the weather record. A wind rose was plotted, basing the wind rose on the sectors divided by lines ±45 ° from the closest turbine to the residence, as shown in Figure 15. The total wind hours are slightly less than the 1633 hours of the audit due to some zero wind speed hours.
Figure 15.Wind Rose for Second Residence
Results Sub-Section Part 4 – Initial Evaluation of Tonality Using Graphical Tone-to-Noise Method
This sub-section gives the results for an initial evaluation of the samples analyzed at both residences using a simplified Tone-to-Noise Ratio (TNR) Method.
1) The Simplified Tone-to-Noise Ratio Method
a) Using the example of one case from the first residence, the simplified Tone-to-Noise Ratio method used to assess tonality for the potential cases identified as of tonal concern followed these steps:
i) The sound recording from microphone mounted on the east end of the residence collected by the SAM Scribe for the time of the identified concern was listened to in order to identify a segment, generally 90 seconds long, which was free from road traffic noise, voices, bird songs, and other contaminants.
ii) The Electroacoustics Toolbox application was used to prepare a display of the FFT from the segment, using a 17226.5 Hz frequency span, a 0.5 Hz sampling frequency, with a Hann window type, and at least 10 linear averages, with a 50% overlap and a flat frequency weighting.
iii) The sound level meter tool in the application was used to prepare displays of the A weighted, C-weighted, and Z-weighted (flat) filtering.
iv) Additionally, the third-octave analysis feature of the application was used to prepare displays of the A-weighted, C-weighted, and Z-weighted one-third octave displays as another indicator for tonality. A typical display is shown in Figure 16.
Figure 16.Sample Display from Analysis of Sample 2019-01-24
b) The display in Figure 16 indicates a tonal peak at 461Hz, dBA, C and Z sound level readings of 45.0, 54.8, and 76.5 dB, and an indication of a tonality peak on the one-third octave chart in the 500 Hz one-third octave. A notable point is that the A-weighted (bottom) one-third octave display shows the peak in the 500 Hz one-third octave is at a point of maximum audibility since the peak is at the highest point in the chart.
c) The FFT display was then used to “zoom-in” on the peak at 461 Hz as shown in Figure 17. Cursors were added to represent the upper and lower limits of the critical bandwidth for this peak, at 403 Hz and 518 Hz. The critical bandwidth was determined from the equation given in IEC 61400-11 Ed 3 13 Equation (30) as:

d) A first approximation of the tonality can be made by subtracting the value (20.17 dB) by centering the upper and lower limit values for the critical bandwidth from the peak value at 461 Hz (31.55 dB) to give a tonality of 31.55 dB – 20.17 dB or ~ 11.4 dB. The average between two dB values is not simply the linear average, but in compensation, taking the single peak value is not representative of the tonal peak energy. Figure 17 shows there are multiple peaks within the critical band, with values of 31.55 dB @ 461 Hz, 31.37 dB @ 449.5 Hz, 30.48 @ 465.5 Hz, and 30.33 dB @ 455 Hz. A closer approximation of the tonal peak can be made by applying simplified log addition of these values.
Figure 17.Sample Tonality Test from Zooming the FFT around the Peak
i) 31.55 dB + 31.37 dB can be represented as 31.55 dB + 3 dB or ~ 34.5 dB.
ii) 31.37 dB + 30.48 dB can be represented as 31.37 dB + 2 dB or ~ 33.4 dB
iii) Then, taking the sum of the sums, 34.5 dB + 33.4 dB can be represented as 34.5 dB + 2 dB or ~ 36.5 dB.
iv) Thus, a tonality of about 36.5 dB – 20.2 dB or 16.3 dB might be considered as a closer approximation.
e) Analysis of all the potential tonal cases was done using only the first order approximation, without correcting for multiple tonal peaks within the same critical bandwidth to determine the results
2) Analysis of Complaint Cases for First Residence
a) Considering the 3192- hour period from Dec. 18 (noon) to April 30 (noon) when the audit regulatory was in progress at the resident’s home, the resident recorded 124 specific examples for analysis. This data set was reduced by 7 cases, to prevent examples displaying similar conditions within 1 hour of each other, reducing the data set to 117 specific cases. These gave examples of tonality (102 cases), quiet (6 cases) and other noise conditions (9 cases). Table 2 summarizes the complaint data.
Table 2. Residence One Complaint Data| Residence One Complaint Data Evaluation | |||||||||||||
| Category | Total | Tonal Examples | Quiet Examples | Other Examples | |||||||||
| Total Hours Logged | 124 | N | S | E | W | N | S | E | W | N | S | E | W |
| Reduction – Same hour & Similar Condition | 7 | ||||||||||||
| RemainingHours to Review | 117 | 3 | 27 | 32 | 40 | 2 | 1 | 2 | 1 | 1 | 6 | 0 | 2 |
| No Data(SAM Unavailable) | 31 | 0 | 6 | 11 | 12 | 0 | 0 | 0 | 1 | 0 | 1 | 0 | 0 |
| Remaining to Evaluate | 86(73 Tonal) | 3 | 21 | 21 | 28 | 2 | 1 | 2 | 0 | 1 | 5 | 0 | 2 |
| Tonal Hours > 5 dB | 61 | 2 | 18 | 17 | 24 | ||||||||
| Fraction Tonal > 5dB | 84% | 67% | 86% | 81% | 86% | ||||||||
| Reasons not tonal | Strong East Wind | 4 | |||||||||||
| AgricultureOperations | 1 | ||||||||||||
| Geese / Swans | 2 | ||||||||||||
| Other | 0 | 1 | 0 | 4 | |||||||||
b) During 31 of the 117 identified cases, the SAM monitoring system was unavailable to give a recording of the acoustic conditions present. A cable connecting to the hard drive storing the data had become disconnected. The results of the remaining 86 recorded times analyzed by the simplified Tone-to-Noise-Ratio (TNR) method is given here:
i) The residents had noted 73 of these times as tonal.
ii) 61 of these (84%) had tonality values ranging from 5 to 15.5 dB, at frequencies between 405 and 488 Hz. 12 cases (16%) could not be resolved for tonality > than 5 dB (but often were shown to be tonal at slightly lesser values such as 4 dB) from the recording taken at the time identified. In these cases, very high noise conditions arising from high winds from the east directly impinging on the microphone, nearby agricultural operations, or nearby water fowl (geese and swans) raised the background resulting in a reduced TNR.
iii) As noted earlier, the ANSI standard S1.13-2005 Annex A 9 shows that a tone will be just audible when the sound pressure level of the tone is about 4 dB below the sound pressure level of the masking noise contained in the critical band centered around the tone. The 5-dB threshold used in this simplified evaluation is already 9 dB above the value identified by ANSI as audible.
iv) 5 of the 86 recorded times were examples of quiet background conditions with no tonality present.
v) The 8 remaining times noted by the residents as “not tonal” but by descriptive words such as thunderous, whooing, crashing, like an airport, or like a train were also analyzed. None of the samples that were identified as being “not tonal” were determined to be tonal.
c) The strong correlation (84%) between identification of tonality by the residents and that determined to be over 5 dB by the Tone-to-Noise Ratio (TNR) method as well as the fact that none of the samples identified as “not tonal” were found to be tonal gives a high degree of confidence that when the residents identified the existence of tonality (which they had done since the wind turbines came into operation in 2015) was indeed an accurate description.
3) Analysis of Complaint Cases at Second Residence
a) The resident provided 102 sound samples for analysis, representing 25 of the 32 days between March 10, and April 10, 2019. Although the resident was not at home for all of the days between March 10 and April 10, it is notable that 25 of 32 possible days represented troublesome times. A typical output of the Electroacoustic Toolbox application is shown in Figure 18 for this residence.
Figure 18.Analysis of sound file from 2019-03-10 at 16:59 hours showing indications of tonality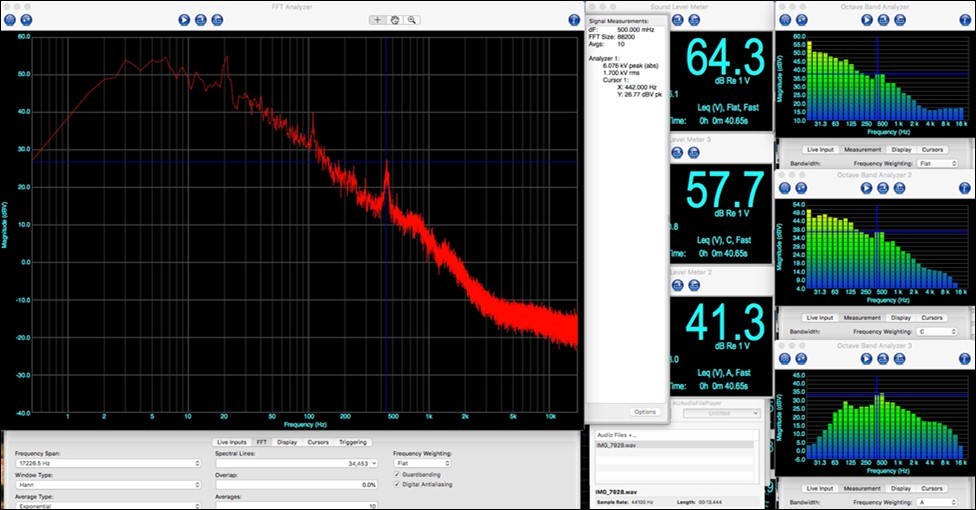
b) Selecting 24 samples for analysis to represent different days, the displays showed little variation (the conditions were not random.) Tonality of at least 10 dB in magnitude at a frequency from 422.5 to 455 Hz was observed on 20 of the 24 samples. However, when viewed on the 1/3 octave analyzer display, the tonal value was often very near the division between the 400 Hz (nominal) 1/3 octave and the 500 Hz (nominal) 1/3 octave, thus appearing to be spread over both of the 1/3 octaves.
c) Comments provided by the resident with the samples showed the perceived tonality resulted in ear pain and pressure in their ears, lost sleep, very poor sleep, restless nights, and were described as annoying, irritating, very irritating, and very, very irritating. Even with the room window closed the sound was described as more apparent inside the room than outside the home. Figure 19 shows a comparison of the narrow band analysis of sound samples pointed out the room window with a sample taken directed into the room. Conditions inside the room show more roughness than outside.
Figure 19.Comparing analysis of sound sample directed out of or into the room
d) Comparison was also made of the difference in the narrow band analysis of samples taken when the wind turbine array output was 15 MW and 256 MW, shown in Figure 20. The results show the presence of the tonal peak during the at power operation, as well as the increase of about 10 dB for frequencies at 1000 Hz. A-weighted sound audibility charts in acoustics texts (example from P. 74 Hansen, Wind Farm Noise 18 used) show human audibility at 1000 Hz has a correction of 0 dB (A,C, or Z weighted).
Figure 20.Comparing narrow band analysis between 15 MW and 256 MW array output
Results Sub-Section Part 5 – Detailed Evaluation Using Tonal Audibility Method
The method discussed in Sub-Section 4 was intended to be a quick method of determining if tonality exists, without requiring a detailed numerical assessment. To ensure that the quick method does represent reality this Sub-Section performs a detailed assessment of 12 of the same examples as analyzed in Sub-Section 4, using the rigorous method of Tonality Audibility as defined by International Energy Agency (IEA) 12 and International Electrotechnical Commission (IEC) 13 documentation. The Tonal Audibility method is the principal method of determining tonality identified in the International Standard 61400-11 Ed 3.0 (2012), Wind turbines – Part 11: Acoustic noise measurement techniques.
1) An early reference to the assessment of Tonality Audibility is found in the Expert Group Study on Recommended Practices for Wind Turbine Testing and Evaluation of Wind Turbines at Noise Receptor Locations, submitted to the Executive Committee of the International Energy Agency Programme for Research and Development on Wind Energy Conversion Systems, 1st Edition 1997, edited by Sten Ljunggren of the Royal Institute of Technology, Sweden. 12 The report is available for download from the International Energy Agency (IEA) Wind Technology Collaboration Programme (IEA Wind TCP).
2) The report discusses the determination of tone levels in section 8.8. It describes tonality as the difference between the sound pressure level of the tone and the broadband noise over the range of the critical band (the ‘masking noise’). This document defines the critical band for frequencies between 20 and 500 Hz as 100 Hz, and for a centre frequency above 500 Hz a critical bandwidth of 20% of the centre frequency is used.
3) IEC 61400-11 Ed 3 13 Equation (30) calculates a specific critical bandwidth as described previously in Results Sub-Section 3. For the typical tonal frequency of 461 Hz seen during this work, the IEC document calculates a critical band from 403 Hz to 518 Hz, for a critical bandwidth of 115 Hz.
4) The Recommended Practices outlined by the Expert Group Study then defines the masking noise level in the critical band, in equation (15) of their report using the lines classified as masking and correcting for a reduction in the number of lines due to the exclusion of tones, and for the influence of the Hanning window as follows:
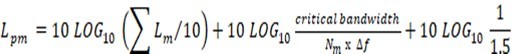
Where Lpmis the masking level within the critical band, Lm is the sound pressure level of each line classified as masking noise,
Nmis the number of lines within the critical band classified as masking noise,
f is the nominal frequency resolution
5) In contrast, IEC 61400-11 Ed 3 defines the masking noise level in equation (31) as follows:

Where Lpn,avg,j,k is the energy average of the spectral lines identified as “masking” within the critical band.
The effective noise bandwidth is 1,5 times the frequency resolution, which includes a correction for the use of the Hanning window.
6) In general the method the Expert Study Group report discusses is carried into the IEC 61400-11 Ed 3.0 (2012), Wind Turbines – Part 11: Acoustic noise measurement techniques Section 9.5. The description of the masking noise level is altered, but generates the same results.
7) Both methods use narrowband analysis to determine:
The sound pressure level of the tone
The sound pressure level of the masking noise in the critical band around the tone
Tonality as the difference between the tone sound pressure level and the masking noise level
Tonal audibility as the difference between the tonality and the audibility criterion of the tone
8) As identified in the IEC standard, 12 - 10 second samples were analyzed for 12 cases to determine the tonal audibility and calculated tonality by rigorous calculation to compare to the quick graphical evaluation that was previously described in subsection 4. The full comparison of results is included in Table 3.
Table 3. Tonality Method Comparison| Sample Date& Tonality byGraphicalAnalysis | FFT Window Resolution(Hz) | Average Tonality∆Ltn,k(dBA) | AverageTonal Audibility∆La,k(dBA) | # of 12 Spectra with ∆La,j,k> 0 dB(audible) | # of 12 Spectra with ∆La,j,k> -3 dB(reportable) | AverageMasking Sound LevelLpn,k |
| 2018-11-16 (14.6 dB) | 2.0 | -1.27 | 0.99 | 6 | 7 | 37.15 |
| 1.35 | 0.82 | 3.24 | 8 | 10 | 35.29 | |
| 1.0 | -0.84 | 1.41 | 5 | 6 | 37.45 | |
| 2018-11-17 (10.8 dB) | 2.0 | -7.92 | -2.53 | 1 | 2 | 37.69 |
| 1.35 | -3.72 | -1.47 | 1 | 4 | 35.43 | |
| 1.0 | -5.06 | -2.82 | 1 | 1 | 37.79 | |
| 2018-12-10 (10.5 dB) | 2.0 | -2.74 | -0.72 | 4 | 8 | 34.20 |
| 1.35 | -1.98 | 0.26 | 5 | 10 | 32.37 | |
| 1.0 | -2.93 | -0.69 | 4 | 9 | 34.33 | |
| 2018-12-13 (10.5 dB) | 2.0 | -6.65 | -4.40 | 0 | 1 | 34.58 |
| 1.35 | -5.79 | -3.38 | 1 | 3 | 32.12 | |
| 1.0 | -7.94 | -5.69 | 0 | 1 | 34.27 | |
| 2018-12-27 (11.3 dB) | 2.0 | -1.55 | 0.69 | 7 | 11 | 31.78 |
| 1.35 | -0.41 | 1.78 | 10 | 12 | 29.49 | |
| 1.0 | -0.93 | 1.31 | 9 | 12 | 31.77 | |
| 2018-12-28 (10.4 dB) | 2.0 | -5.59 | -3.58 | 0 | 3 | 43.05 |
| 1.35 | -5.68 | -3.42 | 0 | 4 | 40.90 | |
| 1.0 | -6.92 | -5.44 | 0 | 1 | 43.19 | |
| 2019-01-08 (12.6 dB) | 2.0 | -1.50 | -2.25 | 1 | 6 | 36.59 |
| 1.35 | -3.48 | -1.06 | 3 | 10 | 34.76 | |
| 1.0 | -3.36 | -1.11 | 4 | 9 | 36.66 | |
| 2019-01-15 (4.7 dB) | 2.0 | -7.47 | -4.40 | 0 | 1 | 42.90 |
| 1.35 | -8.43 | -6.17 | 0 | 0 | 40.75 | |
| 1.0 | -8.83 | -6.58 | 0 | 0 | 42.93 | |
| 2019-01-27 (11.1 dB) | 2.0 | -6.11 | -3.85 | 0 | 0 | 41.12 |
| 1.35 | -8.46 | -6.18 | 0 | 0 | 40.77 | |
| 1.0 | -10.51 | -8.25 | 0 | 0 | 41.18 | |
| 2019-03-31 (11.4 dB) | 2.0 | -2.03 | 0.23 | 3 | 6 | 35.63 |
| 1.35 | -1.48 | 1.39 | 6 | 9 | 33.29 | |
| 1.0 | -3.34 | -1.09 | 3 | 5 | 35.61 | |
| 2019-04-05 (10.2 dB) | 2.0 | -8.66 | -6.41 | 0 | 0 | 40.41 |
| 1.35 | -5.81 | -3.38 | 1 | 3 | 38.21 | |
| 1.0 | -7.63 | -5.38 | 0 | 1 | 40.53 | |
| 2019-04-08 (10.4 dB) | 2.0 | -4.32 | -2.37 | 1 | 3 | 40.30 |
| 1.35 | -4.30 | -2.24 | 2 | 2 | 38.36 | |
| 1.0 | -5.89 | -3.63 | 1 | 3 | 40.42 |
9) A 2018 paper on development of models to predict annoyance from tonality by Lee and Wang 21 states, “Caution needs to be taken during the FFT analysis to ensure that the frequency resolution is less than 1% of the tone frequency of interest for Prominence Ratio (PR) and 0.25% for Tone-to-Noise Ratio (TNR).” The approved version of the Ontario Compliance Protocol for Wind Turbine Noise 8 is based on CAN/CSA-C61400-11-07 22, which in turn is based on the IEC Standard 61400-11 Ed. 2.1. 23 The IEC 61400-11 Ed 2.1 specifies in Sub-Section 8.5.1 “General Methodology” of Section 8.5 “Tonality” that the narrowband analysis Frequency Resolution shall be in the range of 2 to 5 Hz for tones of less than 2000 Hz. An assessment was made to determine the difference in tonal determination using Frequency Resolutions of 0.5, 1.0, 2.0 and 5.0 Hz. Results of an assessment to show the impact of tonal determination by different frequency resolutions is given in Table 4.
Table 4. Effect of Varying FFT Window Width in 61400-11| Sample Date | FFT Window Resolution (Hz) | Average Tonality∆Ltn,k(dBA) | Average Tonal Audibility∆La,k(dBA) | # of 12 Spectra with∆La,j,k > 0 dB(audible) | # of 12 Spectra with∆La,j,k > -3 dB(reportable) | Average Adjusted Masking Sound Level Lpn,k |
| 2018-11-16 | 5.38 | 0.82 | 3.07 | 6 | 9 | 35.54 |
| 5.00 | 0.81 | 3.06 | 7 | 7 | 37.43 | |
| 2.69 | 0.89 | 3.15 | 6 | 10 | 36.35 | |
| 2.00 | -1.27 | 0.99 | 6 | 7 | 37.15 | |
| 1.35 | 0.82 | 3.24 | 8 | 10 | 35.29 | |
| 1.00 | -0.84 | 1.41 | 5 | 6 | 37.45 | |
| 0.67 | 0.37 | 2.63 | 7 | 10 | 35.33 | |
| 0.5 | -0.27 | 1.99 | 7 | 8 | 37.17 | |
| 2018-12-27 | 5.38 | -0.94 | 1.30 | 9 | 12 | 29.78 |
| 5.00 | -0.99 | 1.25 | 8 | 12 | 31.77 | |
| 2.69 | -0.64 | 1.59 | 8 | 12 | 30.74 | |
| 2.00 | -1.55 | 0.69 | 7 | 11 | 31.78 | |
| 1.35 | -0.41 | 1.78 | 10 | 12 | 29.49 | |
| 1.00 | -0.93 | 1.31 | 9 | 12 | 31.77 | |
| 0.67 | -0.14 | 2.10 | 10 | 12 | 29.59 | |
| 0.5 | -0.48 | 1.76 | 10 | 12 | 31.64 | |
| 2019-01-08 | 5.38 | -3.13 | -0.88 | 2 | 9 | 35.04 |
| 5.00 | -3.84 | -1.59 | 1 | 8 | 36.70 | |
| 2.69 | -3.51 | -1.27 | 3 | 8 | 35.80 | |
| 2.00 | -1.50 | -2.25 | 1 | 6 | 36.59 | |
| 1.35 | -3.48 | -1.06 | 3 | 10 | 34.76 | |
| 1.00 | -3.36 | -1.11 | 4 | 9 | 36.66 | |
| 0.67 | -3.04 | -0.79 | 3 | 10 | 34.81 | |
| 0.5 | -2.75 | -0.50 | 5 | 11 | 36.65 |
Discussion
Early work by Kryter, 24 and Fastl and Zwicker 25 identified that special characteristics of sound quality (cyclical signature, tonality, roughness, sharpness, impulsiveness, or dominance of noise during sleeping hours) increased annoyance. Work in 1995 on annoyance by Landström et al 26, found that while the relationship between noise levels and annoyance was weak, annoyance ratings were significantly increased when tones were present in the noise. An early evaluation by Ryherd and Wang in 2008 of the link between tonal noise conditions and human performance found that clear relationships were not observed, but suggested further work. 27 Later thesis dissertations by Francis 28 and Lee 29 , both at the University of Nebraska – Lincoln under Professor Lily Wang, presented ongoing discussions of the link between tonality and annoyance. A paper by Lee, Francis and Wang 10 provided a thorough review of the literature on tonality and annoyance. The same three authors published more work on how tonality and loudness relate to annoyance and task performance. 30 Later work by Lee and Wang 31 dealt specifically with how tonality impacts human annoyance and performance and compared models that predict annoyance based on loudness and tonality, with models based on loudness and sharpness. Lee and Wang found that compared to accounting only for tonality of the most prevailing tone and signal loudness, predictions of annoyance from noise (produced by building mechanical systems) are improved by considering the frequency and the structure of other tones in the noise signal using a weighted-sum tonal audibility. They concluded their paper noting the need for further study of the effects of time-fluctuating properties of tones in noise. The link between tonality, annoyance, and performance is becoming clearer. Meanwhile, in many jurisdictions, using the example of Ontario 8, the principal criteria for acceptability of the sound received by residents from wind turbines has been based on A-weighted noise level, with tonal presence only requires a small adjustment, with no examples of it being applied.
The K2 Wind Tonality Assessment Report32 filed on behalf of the operator in 2019 identifies that the tonality audibility results for the K2 wind power project calculated in accordance with International Standard 61400-11 Edition 3.0 identified tonality values from -4.9 to 3.3 dB, with tonal audibility ranging from -2.9 to 5.5 dB for the three sites evaluated.
This paper has shown that the soundscape experienced by residents impacted by wind turbines in this study exhibited the specific characteristic of tonality as well as time-fluctuating properties of the tone in the broadband noise. Residents used descriptive words such as the “woo-woo-woo” characteristic of the tonal noise rising and falling in amplitude, as it rose and fell, or “wooing.” This was different from the broadband rising and falling of noise, sometimes described as the “swooshing” (amplitude modulation) of the broadband noise from a wind turbine as the blades rotate. Residents have described this rising and falling tonal noise as irritating since the turbines went into operation. An earlier description of the problem was described in published work in 2017. 33
Collection of sound samples by the author at a different wind power development 34 employing the same type of Siemens SWT-2.3-101 MW wind turbines located about 40 km north of the array investigated in this research project confirmed the presence of very similar tonal sound conditions. The tonality is not specific to one particular location.
A review on the auditory and non-auditory effects of noise on health by Basner, et al 35 notes that, “Evidence of non-auditory effects of noise exposure on public health is growing. Observational and experimental studies have shown that noise exposure leads to annoyance, disturbs sleep and causes daytime sleepiness, affects patient outcomes and staff performance in hospitals, increases the occurrence of hypertension and cardiovascular disease, and impairs cognitive development in schoolchildren.” The paper presents data showing that sleep disturbance and noise annoyance attributed to environmental noise exposure in Europe are the principal contributors to the loss of over 1.5 Million Disability-Adjusted lifeyears (DALYs) annually. The paper states, “Noise annoyance can result from noise interfering with daily activities, feelings, thoughts, sleep, rest, and might be accompanied by negative responses such as anger, displeasure, exhaustion, or stress-related symptoms.”
Work published in 2012 by Yang and Kang 36 considered the difference in preference among humans for natural sounds, such as water sounds and birdsongs, as opposed to man-made sounds. Key indices were identified as fluctuation strength, loudness, and sharpness. Their paper provides references to previous soundscape work by authors such as Schulte-Fortekamp, Fiebig, and Genuit.
A comprehensive review of the biological effects of noise is described in work of the International Commission on Biological Effects of Noise by Basner et al 37. This work discusses wind turbines, and recognizes that “wind turbine noise has emerged as an important source of annoyance,” but does not specifically discuss tonality.
The Council of Canadian Academies Expert Panel on Wind Turbine Noise and Human Health 38 listed eleven findings including,
The evidence is sufficient to establish a causal relationship between exposure to wind turbine noise and annoyance.
There is limited evidence to establish causal relationship between wind turbine noise and sleep disturbance.
The evidence suggests a lack of causality between wind turbine noise and hearing loss.
For all other health effects considered (fatigue, tinnitus, vertigo, nausea, dizziness, cardiovascular disease, diabetes, etc.) the evidence was inadequate to come to any conclusion about the presence or absence of a causal relationship with exposure to wind turbine noise.
In testimony before an Ontario Environmental Review Tribunal hearing, the Decision Document by the Tribunal Chair, Maureen Carter-Whitney 39, notes that witness for the Approval Holder, Dr. Robert McCunney, a medical doctor and research scientist at the Massachusetts Institute of Technology testified that “annoyance associated with wind turbines is a subjective phenomenon that seems to be primarily related to attitudes about the visual impact and economic benefits associated with wind turbines, and that, in his opinion it is not a health effect. In support of his opinion, he cited a number of studies and stated that he was unable to find annoyance described in any medical dictionary and did not locate it as a disease entity in the 10th revision of the International Classification of Diseases (“ICD-10”). Dr. McCunney further stated that the WHO 1948 constitution and subsequent publications do not indicate the WHO considers “annoyance” an adverse health effect and concluded that claims that annoyance is an adverse health effect reflect individual opinion and are not the consensus of the international medical community.”
The 10th Revision of the International Classification of Diseases 40 does specifically note as a cause for disease in clause R45.4 “Irritation and anger.” The Merriam-Webster medical definition of irritate 41 is “to provoke impatience, anger, or displeasure in” and that further, Merriam-Webster defines “annoy” as a synonym for “irritate” and uses the statement as an example, “irritate means to excite a feeling of anger or annoyance.” An alternate definition for irritant is “a thing that is continually annoying or distracting.”
The WHO Regional Office for Europe publishes the document, “Burden of disease from environmental noise – quantification of health life years lost in Europe.” 42 This publication summarizes the evidence on the relationship between environmental noise and health effects, including cardiovascular disease, cognitive impairment, sleep disturbance, tinnitus, and annoyance. Linkage between cardiovascular risk and transportation noise is identified by Babisch 43. McGuire, Müller, Elmenhorst, and Basner discuss the individual differences in the effects of aircraft noise on sleep, noting that environmental noise exposure disturbs sleep and impairs recuperation, and may contribute to the increased risk for (cardiovascular) disease. 44
There would appear to be a significant difference of opinion about the link between annoyance and adverse health effects, and whether it is necessary to call the effects from wind turbines an irritant or as annoying (even if synonyms) to determine whether or not they are an adverse health effect. This paper cannot resolve the difference of opinion between medical spokespersons, but can help to provide a basis for the annoyance / irritation expressed by residents experiencing the tonality of noise from wind turbines.
Dr. Kristy Hansen of Flinders University, Australia, suggested confirming the tonality analysis method used in this corrigendum by analysis of the 31 Round Robin Test spectra reported by Lars Sondergaard at the Wind Turbine Noise Conference 2019 (WTN 2019)45. Analysis confirmed that the tonal audibility calculated for all 31 of the analyses performed were within the standard deviation of the Round Robin Test reported at WTN 2019. However, 10 of the analyses were lower than the average WTN 2019 value by more than 1 dB (up to 5.1 dB lower) while 2 tests were 1.1 and 1.3 dB higher. The overall average difference of tonal audibility results calculated using the methods of this paper were 1.3 dB lower than the WTN 2019 averages, meaning that the tonal audibility calculations used in this analysis would be slightly lower than the average of the results after the “outliers were removed” from the 31 Round Robin Spectra as presented at WTN 2019. The fact that the Sondergaard paper identifies the 24 participants in the Round Robin Test generated analysis results for the same sample spectra with some variation (outliers) identifies that FFT analysis of complex waveforms may generate similar but slightly different results. The 31 Round Robin Spectra were reanalyzed using the Audacity audio editor. Using the Audacity audio editor results, all 31 Spectra were within ±1 dB of the average values given in the WTN 2019 paper. For this reason, the Audacity analysis using a 1.35 Hz window was added for all of the results given in this corrigendum
The Simplified Graphical Method shown in the original paper presented the average tonality of the 12 samples as 11.2 dB by calculating the difference between the peak value at the tonal centre frequency, compared to the values at the edges of the critical bandwidth around the centre frequency. However, the tonality calculated by the IEC 61400-11 Ed 3.1 method reduces the average tonality of the samples to -3.3 dB. It is noted that 10 of the 12 cases show some of the 10 second cases analyzed for each date to meet the threshold for reportable tonal audibility ( > -3 dB).
Tonal Audibility (defined by IEC 61400-11 Ed 3.1 as an average value > 0 dB with at least 6 samples > 0 dB) shows only 3 of 12 of the analyzed samples to be “audible.” The fact that only 3 of the 12 samples can be shown by analysis according to the IEC standard as “audible” is remarkable. A listening test of all 12 of the samples clearly presents an audible tonal signature on each, and 11 of the 12 samples show by graphical presentation of the sample FFT, to have a peak value > 10 dB higher than the average values on either side of the “critical bandwidth” surrounding the tonal peak.
Principal Findings
This paper demonstrated acceptable readings from a microphone located on the gable end of a home that did not need to be taken out of service during rain or snow to allow continuous recording of conditions, as an alternative to a free-field location which is not suitable for continuous recordings in adverse weather which can render data unusable.
This paper showed that analysis of the sound files collected at the homes of two resident families confirmed high correlation between times the residents described as tonal and the presence of tonality by a graphical method of comparing the tonal peak to the magnitude of the sound outside the critical bandwidth centered on the tonal peak.
The paper showed that regulations which require analysis only of situations when a resident is downwind of the nearest wind turbines, or when wind turbines are at high power will miss the majority of irritating cases.
The paper showed that the majority of irritating tonal cases did not occur when the resident was downwind of the nearest wind turbines.
The paper shows that “curtailing” the wind turbine operation (partially reducing the output) may result in enhanced tonality.
Some regulatory documentation based on the earlier IEC-61400-11 Ed. 2.1 version (as in Ontario) requires that the narrow band analysis use a sample width of 2 or 5 Hz for tonal cases below 2000 Hz. Current research recommends a sample width of no larger than 0.25% of the tonal frequency. For the tonality present in this study in the order of 450 Hz, that would require a sample width in the order of 1 Hz or smaller. The paper demonstrates the effect of the change is that compliance with the regulations based on IEC 61400-11 Ed 2.1 (as in Ontario) can reduce cases that were clearly tonal by a listening test when using smaller sample windows to “not-tonal” when using the window width required by the regulation.
Conclusion
This research has demonstrated that tonality as defined by international documentation is present at the site under investigation 1 (K2 Wind in Ontario) as a chronic condition, and has been for about 5 years without abatement. Tonality is also present at a different location 34 (Armow Wind) employing the same variety of wind turbines. Tonality was present at some times on each day the wind turbines were operating when the capability was higher than about 50% even when the turbines were curtailed (operating at less than forecast output), and data showed tonality was continually present on some days for periods of up to 8 hours. This tonal condition was described by the residents as irritating and annoying, resulted in loss of sleep, and results in loss of enjoyment of normal use of their property. International research confirms that tonality can be a contribution to irritation, and irritation can pose an adverse health impact. The research identified a significant difference between the method of determining tonality as described by the Recommended Practices for Wind Turbine Testing and Evaluation of Wind Turbines at Noise Receptor Locations made by the Expert Group Study to the International Energy Agency compared with the method described in current International Electrotechnical Commission standards, which are the basis for many national standards. The difference can result in a significant (and inaccurate) reduction of tonality and tonal audibility when following the International Standard, such as the difference between the K2 Tonality Assessment 32 filed for the operator and the results identified for tonality and tonal audibility in this paper.
The simplified graphical analysis shows 11 of the 12 cases having the tonal peak at least 10 dB greater than the average of the sound pressure level just outside the critical bandwidth, when all 12 of the cases were described by the residents as irritating to the point of being reportable. This contrasts with the results of analysis using the IEC method which shows only 3 of the 12 samples to be audible. These conflicting results suggest the need for further investigation.
Funding
This research project was funded by the investigator and received no external funding. It is noted that the instrumentation purchased by the residents to collect the data was at their expense, and is their personal property.
Acknowledgements
I wish to acknowledge the patience and understanding of the residents who provided the data collected by their personal instrumentation, as well as their records of observations. Both were instrumental to being able to conduct this research. This report has been nearly 4 years in preparation since the residents first identified the irritation they were facing on a daily basis, and their patience in the face of adversity has been remarkable. Thank you for not losing patience with my snail’s pace.
I also acknowledge the support of the Member of Provincial Parliament (Lisa Thompson MPP-Huron-Bruce) representing the residents, and the neighbouring MPP (Bill Walker MPP – Grey-Bruce-Owen Sound) for their encouragement and confidence, and for caring for the well-being of those they represent.
Dr. Colin H. Hansen, Professor Emeritus in the School of Mechanical Engineering, University of Adelaide (Australia) reviewed and commented on this manuscript after it was completed. Dr. Hansen identified that contrary to what was stated in the original paper, there was no difference between the calculation of the masking noise level in the Recommended Practices for Wind Turbine Testing and Evaluation of Wind Turbines at Noise Receptor Locations, and the masking noise level described in the International Electrotechnical Commission (IEC) document IEC 61400-11. The review, and identification of the error made in the original paper was greatly appreciated.
The review for formatting and overall content done by Mr. Santo Giorno is acknowledged with thanks as each reviewer adds to the readability of the paper.
The Google Map Template used in Figure 12 is used on accordance with the criteria of the Google Maps Universal Terms and Maps/Earth Additional Terms of Service.
Most of all, I acknowledge the love, support and understanding of my wife, companion, and conscience, Jean, for not becoming totally exasperated with my single purposed focus as I worked on this project.
References
- 1.Pattern Energy Group (2020) Inc. K2 Wind Harvesting the Wind for Ontario. Published. AccessedMay12,2020. https://k2wind.ca/
- 2. (1990) Government of Ontario. ENVIRONMENTAL PROTECTION ACT, R.S.O. C. E.19. Government of Ontario; https://www.ontario.ca/laws/statute/90e19 .
- 3.Bakker H, Rapley B, Summers R, Alves-Pereira M, Dickinson P. (2017) An Affordable Recording Instrument for the Acoustical Characterisation of Human Environments. In:. 12th ICBEN Congress on Noise as a Public Health Problem 1-12.
- 5. (2020) . MOVO Inc. Movo MA2000 U-Shape TRRS Measurement Mic. AccessedMay12,2020. https://www.movophoto.com/products/movo-ma2000-u-shape-trrs-calibrated-measurement-microphone .
- 6. (2020) . Government of Canada E and NR. Daily Data Report forMay2020- #Climate - Environment and Climate Change Canada.AccessedMay12,2020. https://climate.weather.gc.ca/climate_data/daily_data_e.html?StationID=7747 .
- 7. (2020) Industrial Electricity Supply Operator. IESO,Featured Reports, Generator Output and Capability. Power Data - Generator Output and Capability. Published. Accessed May12,2020. http://www.ieso.ca/en/Power-Data/Data-Directory
- 8.Ontario M.Compliance protocol for wind turbine noise. Published 2017. AccessedMay12,2020. https://www.ontario.ca/page/compliance-protocol-wind-turbine-noise
- 9.. Acoustical Society of America. American National Standard ANSI S1.13-2005 Measurement of Sound Pressure Levels in Air.; 2010: 52.
- 10.Francis J M, Lee J, Wang L M. (2014) Determining Annoyance Thresholds of Tones in Noise.;. http://digitalcommons.unl.edu/archengfacpubhttp://digitalcommons.unl.edu/archengfacpub/73
- 11. (2007) International Standards Organization. ISO1996-2Acoustics-Description, Measurement and Assessment of Environmental Noise-Part 2: Determination of Environmental Noise Levels Acoustique-Description, Évaluation et Mesurage Du Bruit de l’environnement-Partie 2: Détermination Des Niveaux de Bruit.
- 12.Ljunggren S. (1997) Recommended Practices For Wind Turbine Testing I.O. Measurement Of Noise Immission From Wind Turbines At Noise Receptor Locations1.Edition1997.Edited by S.Ljunggren.;1997. https://www.osti.gov/etdeweb/biblio/615530.
- 13. (2012) . International Electrotechnical Commission., International Electrotechnical Commission. Technical Committee 88. IEC 61400-11 Ed. 3 Wind Turbines. Part 11, Acoustic Noise Measurement Techniques. 3.0. International Electrotechnical Commission; .
- 14. (2020) online-convert.com. Online converter - convert video, images, audio and documents for free. AccessedMay12,2020. https://www.online-convert.com/
- 15. (2020) Faber Acoustical. Electroacoustics Toolbox. AccessedMay12,2020. https://www.faberacoustical.com/apps/mac/electroacoustics_toolbox/
- 16. (2020) Rodan Energy. Rodan Market Dashboard Generator Output for. K2WIND [K2 WIND ONTARIO LTD PARTNERSHIP]. AccessedMay12,2020. https://www.sygration.com/gendata/today.html .
- 18.Colin H Hansen, Con J Doolan, Hansen K L. (2017) Wind Farm Noise: Measurement, Assessment and Control.JohnWiley&Sons,Incorporated.
- 19.Lehto Panu, C Di Napoli. (2014) Signal analysis of wind turbine acoustic noise School of Electrical Engineering.
- 20.Pedersen T H, Søndergaard M, Andersen B. (1999) DELTA Acoustics & Vibration Objective Method for Assessing the Audibility of Tones. in Noise Joint Nordic Method-Version 2 AV 1952/99. dk-TEKNIK ENERGY Environ. Published online 1-18.
- 21.Lee J, Wang L M. (2018) Development of a model to predict the likelihood of complaints due to assorted tone-in-noise combinations. , J Acoust Soc Am 143(5), 2697-2707.
- 22. (2012) Standards Council of Canada. CAN/CSA-C61400-11: 07 (R2012) Wind Turbine Generator Systems - Part 11: Acoustic Noise Measurement Techniques -.;. https://www.scc.ca/en/standardsdb/standards/23607
- 23. (2006) . International Electrotechnical Commission., International Electrotechnical Commission. Technical Committee 88. IEC 61400-11 Ed 2.1 Wind Turbine Generator Systems. Part 11, Acoustic Noise Measurement Techniques. 2.1. International Electrotechnical Commission; .
- 24.Kryter K D. (1970) The Effects of Noise on. Man. 1st ed. (Lee, Douglas H.K., Hewsooon, E. Wendell, Gurnham CF, ed.)
- 25.Fastl H, Zwicker E. (1990) Psychological Facts and Models. 1st Editio. Series in Information Sciences; .
- 26.Landström U, Åkerlund E, Kjellberg A, Tesarz M. (1995) Exposure levels, tonal components, and noise annoyance in working environments. , Environ Int 21(3), 265-275.
- 27.Ryherd E E, Wang L M. (2008) Implications of human performance and perception under tonal noise conditions on indoor noise criteria. , J Acoust Soc Am 124(1), 218-226.
- 28.Francis J M.Determining Thresholds of Annoyance to Tones in Noise. Published online 2014. http://digitalcommons.unl.edu/archengdisshttp://digitalcommons.unl.edu/archengdiss/32
- 29.Lee J.The Effects of Tones in Noise on Human Annoyance and Performance. Published online 2016. http://digitalcommons.unl.edu/archengdisshttp://digitalcommons.unl.edu/archengdiss/39
- 30.Lee J, Francis J M, Wang L M. (2017) How tonality and loudness of noise relate to annoyance and task performance. , Noise Control Eng J 65(2), 71-82.
- 31.Lee J, Wang L M. (2020) Investigating multidimensional characteristics of noise signals with tones from building mechanical systems and their effects on annoyance. , J Acoust Soc Am 147(1), 108-124.
- 33.WKG Palmer. (2017) Why Wind Turbine Sounds are Annoying , and Why it Matters Identify character of wind turbine arrays in. iMedPub Journals - Glob Environ Heal Saf. 1(2), 1-17.
- 34. (2020) Pattern Energy Group. Harvesting the Wind for Ontario. Armow Wind - Harvesting the Wind for Ontario. Published2020. https://armowwind.com
- 35.Basner M, Babisch W, Davis A, Brink M, Clark C. (2014) Auditory and non-auditory effects of noise on health. , Lancet 383(9925), 1325-1332.
- 36.Yang M, Kang J. (2013) Psychoacoustical evaluation of natural and urban sounds in soundscapes. , J Acoust Soc Am 134(1), 840-851.
- 37.Basner M, Brink M, Bristow A. (2015) ICBEN review of research on the biological effects of noise2011-2014. , Noise Heal 17(75), 57-82.
- 38. (2015) Council of Canadian Academies. Understanding the Evidence: Wind Turbine Noise The Expert Panel on Wind Turbine Noise and Human Health.;. https://cca-reports.ca/reports/understanding-the-evidence-wind-turbine-noise/
- 39. (2019) Ontario Environmental Review Tribunal MC-W. ERT 18-028 Nation Rise Decision.;. https://elto.gov.on.ca/tribunals/ert/case-search/
- 40. (2019) World Health Organization (WHO). ICD-10 Version 2019. International Statistical Classification of Diseases and Related Health Problems 10th Revision. Published2019. AccessedMay13,2020. https://icd.who.int/browse10/2019/en .
- 41. (2020) . Merriam-webster. Irritate | Medical Definition of Irritate by Merriam-Webster. Published2020. AccessedMay12,2020. https://www.merriam-webster.com/dictionary/irritate#medicalDictionary .
- 42. (2011) WHO European Centre for Environment and Health, Bonn Office WRO for E. Burden of Disease from Environmental Noise Quantification of Healthy Life Years Lost. in Europe. https://www.who.int/quantifying_ehimpacts/publications/e94888/en/
- 43.Babisch W. (2006) Transportation noise and cardiovascular risk: Updated Review and synthesis of epidemiological studies indicate that the evidence has increased. , Noise Heal 8, 1-29.
Cited by (2)
This article has been cited by 2 scholarly works according to:
Citing Articles:
A. Dumbrille, R. Mcmurtry, Carmen M. E. Krogh - Environmental Disease (2021) Semantic Scholar
Environmental Disease (2021) OpenAlex